

What is Electrochemical Impedance Spectroscopy (EIS)? Electrochemistry Basics Series
Latest updated: May 23, 2025A comprehensive guide to electrochemical impedance spectroscopy (EIS)
Electrochemical impedance spectroscopy (EIS) has helped to revolutionize research in the field of electrochemistry, and it is now widely considered a key technique for researchers wishing to characterize electrochemical reaction mechanisms and optimize battery materials. In this article, we will present a formal definition of EIS, how it can be used in the field of electrochemistry, how it is represented and the various precautions necessary when performing EIS measurements. This article serves as an introduction for anyone wanting to discover the extremely powerful technique that is Electrochemical Impedance Spectroscopy.
A definition of Electrochemical Impedance Spectroscopy
In electrochemistry, there are two main types of techniques: Direct Current (DC) and Alternative Current (AC) techniques.

The EIS technique, due to the usual sinusoidal stimulation waveform, is often identified as an AC (Alternating Current) technique as opposed to the other techniques identified as DC (Direct Current) techniques.
DC techniques mainly include potential or current step, pulsed and sweep methods such as Chronopotentiometry, Chronoamperometry, Linear Scan Voltammetry or Cyclic Voltammetry. In simple terms, with DC techniques, the response of an electrochemical system is studied as a function of time.
With AC techniques, such as Electrochemical Impedance Spectroscopy (EIS), the response of the system to a potential or current sinusoidal perturbation is studied as a function of the frequency, which is swept over a few decades* A decade is a unit for measuring ratios on a logarithmic scale, one decade corresponding to a ratio of 10 between two numbers (Fig. 1). The frequency sweep enables access to all processes taking place at the electrode: charge transfer and mass transport. Any other electrical contribution and artefacts are visible with EIS.

Figure 1 : Representation of the response of a Linear Time-Invariant (LTI) system to a sinusoidal potential perturbation at various frequencies.
What are the benefits of Electrochemical Impedance Spectroscopy (EIS) and where is it used?
The main advantage of EIS is that it can rapidly characterize the electrochemical system that you are interested in.
Because you can scan from rather high (MHz) to low (mHz) frequencies, most of the processes, from the slowest to the fastest, can be characterized with a single scan. Also, the ability to choose different steady-state values, means you can characterize the behavior of your system at different operating points, for example for a battery at different States of Charge (SoC).
As such, EIS is not more complicated than Cyclic Voltammetry, once you get to understand how to set the input parameters and that there is an additional layer of analysis or modeling, using the electrical equivalent circuit as is described later.
Impedance Spectroscopy comes from the world of physics and electronics and has been applied to electrochemical systems only since the second half of the 19th century.
It is a generic method that is used in any application field of electrochemistry but also in materials, as any conductive material has a specific dynamic electrical behavior that can be characterized by EIS.
In electrochemistry, the ultimate point of EIS is to characterize an electrochemical process, but it can also be used as an optimization tool for electrochemical devices and applications as wide-ranging as material protection, electrocatalysis in fuel cells, photocatalysis, electrochemical biosensors, photovoltaics, and solar cells (solid-state and dye-sensitized), redox flow batteries, any type of secondary batteries.
At a glance
EIS is a powerful technique: Electrochemical impedance spectroscopy (EIS) is used to study a wide variety of systems in many fields of electrochemistry such as electrode kinetics, double-layer studies, batteries, corrosion, solid-state electrochemistry, bioelectrochemistry, photovoltaic systems. The following two tutorials with give more specific information about using Electrochemical Impedance Spectroscopy with battery and corrosion applications Tutorial II: Corrosion Tutorial III: Battery testing
EIS is a sensitive technique: It can measure tiny signals, so as with all sensitive techniques, certain precautions should be considered with EIS. These are explained in the following tutorial. Tutorial IV: Experimental conditions
The representation of EIS data
It is well known that the response of a linear time-invariant (LTI) system to a sine wave stimulation $\delta I \sin(2 \pi f t)$ with amplitude $\delta I $ and frequency $f$ is also a sine wave of the $f$ frequency with phase-shift of $\phi$ with $\phi= 2 \pi \Delta t/T$ as shown in Fig. 2.

Figure 2: Potential response of Linear Time-Invariant (LTI) system to a current stimulation for a given frequency $f, T=1/f, \phi= 2 \pi \Delta t/T$
Using Fig. 2, it is possible to define the modulus of Z: $|Z| = \delta E/\delta I$ and its phase $\phi= 2 \pi \Delta t/T$. A modulus and a phase define the polar coordinates of a point M in the plane (Fig. 3) [1]. The polar coordinates |Z| and ϕ can be converted into Cartesian coordinates $\text{Re}\;Z$ and $\text{Im}\;Z$ using the trigonometric functions sine and cosine:
$$\text{Re}\;Z = |Z| \cos \phi,\; \text{Im}\;Z = |Z| \sin\phi,\;\phi=\arctan\left(\frac{\text{Im}\;Z}{\text{Re}\;Z}\right) \tag{1}$$
Which can be written in complex notation
$$Z =\text{Re}\;Z+j \;\text{Im}\;Z= |Z| (\cos \phi+ j \sin \phi) \tag{2}$$
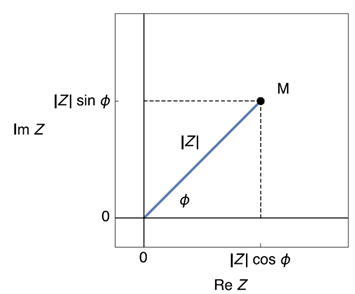
Figure 3: Image of a complex number in the complex plane.
This leads to two types of representations:
- The Nyquist Plot for electrochemists: $\text{-Im}\;Z\;vs. \text{Re}\;Z$. One graph is a parametric plot where each point is at a different frequency.
- The Bode plot: $|Z|\;vs.\;f$ and $\phi\;vs.\;f$. Two graphs where the frequency is explicitly shown.
It is easy to go from one representation to the other as shown below (Figure 4), all you need is a ruler and a protractor.

Figure 4: Nyquist and Bode representation of the impedance of an R+R/C+R/C electrical circuit.
Be careful to use an orthonormal scale when using the Nyquist plot otherwise you might misinterpret your data (Figure 5). For further information please see our Learning Center article “Nyquist plots: Why use the orthonormal scale”

Figure 5: Nyquist plot of the impedance of a Randles circuit with Warburg impedance
showing a sad face when the scale is not orthonormal and a happy face when the scale
is orthonormal, and the low-frequency angle is – 45°.
Further reading
[1] Application Note 50 – 1 The simplicity of complex numbers
Linearity and stationarity – the principal requirements of EIS
As introduced above, impedance measurements should be performed on a Linear Time-Invariant system. The major requirements for impedance measurements are the conditions of linearity and stationarity.
The importance of linearity for electrochemical impedance spectroscopy
Electrochemical systems are non-linear by nature. Linearity can be achieved by using an input amplitude that is sufficiently small. This is illustrated in Figure 6 below. If we consider only a very small part of the steady-state curve, a non-linear behavior can be approximated as a linear behavior.

Figure 6: Non-linear steady-state $E\ vs. I$ curve in blue and its tangent in orange.
By using a small input amplitude the portion of the curve under study around
the operating point can be approximated by its tangent.
Many methods exist to check that the input amplitude is small enough (Lissajous, Kramers-Kronig, fitting with a Voigt circuit). One of the most quantitative methods is Total Harmonic Distortion (THD). Total Harmonic Distortion uses the amplitudes of the harmonics of the output signal, which are produced by the non-linear response of the system and gives, as a percentage, the amount of non-linearity of the system, for each frequency of the input signal.
Figure 7 shows two impedance diagrams and the corresponding THD, as a function of the frequency. The amplitude used to produce the data in orange is clearly too large, as it is generally admitted that 5% is a threshold value to separate a linear and non-linear response.

Figure 7: Left: simulated impedance data on a Butler-Volmer system at two different amplitudes.
The fact that both diagrams are different is proof that the system is non-linear.
Right: Corresponding THD of the response. THD is higher at lower frequencies, meaning the non-linearity also depends on the frequency.
More details are given on THD in the corresponding BioLogic application notes and white paper [2-4], as well as in the following Learning Center article “How to make reliable EIS measurements”.
Further reading
[2] Application Note 64 – EIS Quality Indicators: THD, NSD & NSR
[3] Application Note 65 – THD: parameters affecting its value & comparison with other methods of linearity assessment
[4] White Paper 2 – Systems and EIS quality indicators
The importance of stationarity for electrochemical impedance spectroscopy
Stationarity basically means that during the EIS measurement the response of the object of study does not have any parameter that changes with time. More precisely it means two things:
- The response of the system is not in a transient state but in a steady-state
- The system itself does not have any parameter that changes with time.
This requirement and the various ways to check and correct it are described in greater detail in the Learning Center article “How to check and correct the time variance of your system under EIS measurements”.
The Non-Stationary Distortion (NSD) indicator is a good way to check the stationarity of the system. It follows the same principle as THD as it uses amplitudes of frequencies that are produced by the effect that we want to assess. Like THD, NSD is dependent on the frequency of the signal, but also on the response of the system to the DC polarisation.
Further reading
You can find more information on Total Harmonic Distortion (THD), Non-stationary distortion (NSD) and Noise to signal ration (NSR) in “How to make reliable Electrochemical Impedance Spectroscopy (EIS) measurements with your potentiostat or battery cycler”
NSD can be used to determine a threshold frequency above which the data can be considered as valid. As an example, Figure 8 shows two impedance measurements on a commercial 18650 LFP battery at two different discharge currents. The effect of the current can be seen at lower frequencies on the Nyquist diagrams but more precisely on the NSD indicator from around 0.1 Hz. Data above this frequency can be considered as valid because they do not depend on the discharge current.

Figure 8: Left) Nyquist impedance graph and Right) corresponding NSD E of commercial 18650
LFP battery at two discharge currents: -20 mA (blue) and -25 mA (red). Modulation amplitude of 10 mA.
Frequency range: 100 kHz to 10 mHz.
Further reading
[5] Application Note 69 Part I – How to check and correct non-stationary EIS measurements using EC-Lab® (part 1: corrosion)
[6] Application Note 69 Part II – How to check and correct non-stationary EIS measurements using EC-Lab® (Battery cell)
[7] Application Note 17 – Drift correction in electrochemical impedance measurements
EIS measurements and settings
Figure 9 shows the settings window of the Galvano EIS technique in EC-Lab. More details on whether to choose Potentio EIS or Galvano EIS are given in the following Learning Center article “PEIS or GEIS or GEIS-AA? That is the question” and the corresponding application note [8]. In this part, we will give some indications that can help better choose good values for the most critical parameters.

Figure 9: Settings window of the Galvano EIS technique in EC-Lab®
Further reading
[8] Application Note 49 – EIS measurements: Potentio or Galvano mode ?
Single sine vs. multi sine
In cases where EIS measurements are needed at low frequencies ($f\; < \;1 \; \text{Hz}$), it can be useful to use Multi sine as it will reduce the measurement time. In Multi-sine, the stimulation waveform contains more than just one frequency, it is a combination of several sinus waves at different frequencies. Even though the amplitude is adjusted to avoid non-linear effects, it can be difficult to find the right amplitude. You can find further details and explanations in the corresponding application note [9].
Further reading
[9] Application Note 19 – EIS measurements with multi sine
DC potential or current?
As shown in Figs. 1 and 2, electrochemical impedance spectroscopy measurements can be performed at a given steady-state or DC potential or current. The value really depends on which type of experiment is needed. Many EIS experiments are performed around Open Circuit Voltage (OCV) but it can be interesting to perform electrochemical impedance spectroscopy measurements at a given potential, where a specific reaction takes place for example or where a reaction will occur under specific conditions.
In the field of battery research, EIS can be performed at different voltages, which correspond to different SoCs, or for different discharge currents, but in this case, the NSD indicator should be used to ensure that the system does not vary too much during the measurement.
EIS Frequency range
The choice of the frequency range will clearly depend on the system. For the highest frequency, it should be chosen so that the series resistance is measured, typically 1 – 10 kHz, depending on the system. For high impedance systems, it can be necessary to go to higher frequencies. For low impedance systems, inductive behavior will start to show up. In such cases, it is necessary to account for this when fitting impedance data. Application notes 5 and 45 [10,11] explain how to deal with this issue.
Further reading
[10] Application Note 5 – Precautions for good impedance measurements
[11] Application Note 42 – The modified inductance element La
Modulation amplitude and EIS
This parameter was already discussed above when considering the linearity requirement. The value of the amplitude modulation can be too large if it is considered that it produces a non-linear response of the system, but it can also be considered too small if the data produced are as or less significant than the measurement noise. For this, a third and last indicator is proposed in EC-Lab®: the Noise to Signal Ratio (NSR) indicator. It is explained in more details in the application note 64 [2]. It is easy to know a priori what a small potential input value is but it can be more difficult to know what a small current input value is. This why GEIS-AA can be extremely useful and is described in aforementioned article: PEIS or GEIS or GEIS-AA? That is the question.
When performing EIS measurements at various DC voltages or currents, it can be useful to set a waiting time such that the actual input wave and subsequent system output reaches a steady state before starting the measurement. Also the pw parameter is here to cope with frequency to frequency transitions. Finally, the drift correction tool explained in greater detail in application note 17 [7] can be useful when low-frequency measurements are performed on systems that are not stationary. It must be noted that measurement time will double when drift correction is checked.
Further reading
[2] Application Note 64 – EIS Quality Indicators: THD, NSD & NSR
[7] Application Note 17 – Drift correction in electrochemical impedance measurements
How do I interpret my EIS measurements?
As previously explained in the introduction, EIS is a complementary technique to DC techniques such as step methods or voltammetry, that helps characterizing electrochemical processes occurring at an electrochemical interface, as well as electrical artifacts, such as inductance for instance.
EIS is performed over several decades of frequencies starting most of the time from several MHz to as low as 10 µHz, corresponding in the time-domain to sub-µs and around 300 h. The range of processes that can be characterized in EIS is much wider than for DC time-resolved techniques, for which the sampling rate is around several hundreds of µs (It can be reduced using an analog ramp generator…).
Assuming impedance has been measured in the best possible conditions of linearity and stationarity, the next challenge is “How do we interpret an EIS measurement?”.
Electrical Equivalent Circuit modeling
A commonplace method is to build an Electrical Equivalent Circuit (EEC), using electrical elements (resistor, capacitor, inductance, constant-phase) and electrochemical elements (semi-infinite diffusion, restricted diffusion, bounded diffusion). Then, a fitting tool is used to find the parameter values for which the simulated impedance data and the experimental impedance data are the closest. These parameters should correspond to physical quantities of the considered system.
ZSim (Figure 10) and ZFit (Figure 11) are the names of the impedance simulation and fitting tools available in EC-Lab®, BioLogic’s potentiostat control and analysis interface. The use of ZFit is described in greater detail in the following Learning Center article “ZFit (impedance fitting) tutorials for potentiostats and battery cyclers” which also presents a series of easy-to-follow YouTube videos describing ZFit tools as well as fitting tips and tricks.

Figure 10: ZSim the impedance simulation tool in EC-Lab®
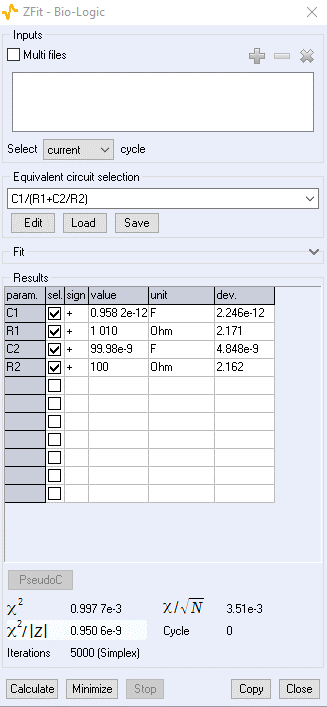
Figure 11: ZFit the impedance fitting tool in EC-Lab®
Understand the background: Electrochemical elements and the electrochemical processes they represent.
Also, the best starting point to build an equivalent circuit is to gain knowledge about the various electrochemical elements that exist and to which electrochemical processes they correspond. BioLogic’s potentiostat software EC-Lab® includes a comprehensive tool in to build and edit equivalent electrical circuits using either in line formulas or graphics (Figure 12). A series of tutorials are available [12-14] as well more application-related information spread out over several application notes Lithium-ion batteries [15-17], redox flow batteries [18], fuel cells [19], redox reaction E on a Rotating Disk Electrode (RDE) [20].
Feel free to dive into these documents and do not hesitate to drop us an email if you need any further information on a specific topic or to interpret your data as we are here to help!
Other invaluable resources are the impedance handbooks, available for free as PDFs [21-25].
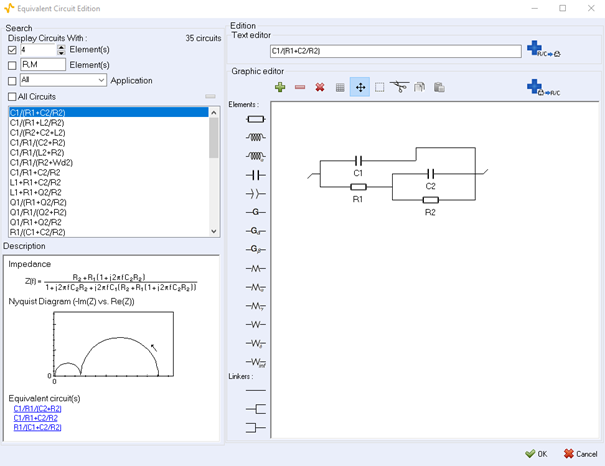
Figure 12: The Electrical Equivalent Circuit editing tool EC-Lab®
Key electrical circuits used in electrochemical impedance spectroscopy
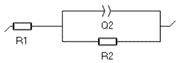
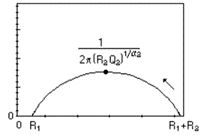
The following are all common examples of equivalent circuits used for interpreting EIS measurements. Please note that the equivalent circuits given below are for one electrochemical interface only. If you study a full battery, for example, there are two electrochemical interfaces so you should replicate the part of the equivalent circuit that is related to the Faradaic impedance.
Please note that the C element, usually used to represent the double-layer capacitance, can be replaced by a constant-phase element (CPE) Q.
| EEC | Nyquist diagram | Electrochemical Process | Devices/Applications |
 | 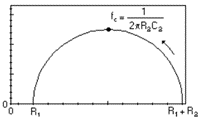 | Butler-Volmer kinetics, or Wagner-Traud (Corrosion) | Redox reaction without transport limitation, Tafelian corrosion |
 |  | Butler-Volmer kinetics, or Wagner-Traud (Corrosion) | Redox reaction without transport limitation, Tafelian corrosion |
 |  | Charge transfer and semi-infinite diffusion | Redox reaction or corrosion with mass-transport limitation (electrode in a quiescent electrolyte, aerobic corrosion) |
 |  | Charge transfer and adsorption (Volmer- Heyrovský mechanism) | Acidic corrosion, electrocatalysis, electrolyzers |
 | Charge transfer and convection-diffusion | Redox reaction at a Rotating Disk Electrode; redox reaction controlled by flowing electroactive species: fuel cells, redox flow batteries | |
| Charge transfer and restricted diffusion: insertion reaction | Lithium-ion batteries, permeation materials, supercapacitors |
Applications: How is EIS used in research and industry?
| Application | Benefits and uses of EIS | Learning Center | Application note |
| Corrosion and EIS | Electrochemical Impedance Spectroscopy is used to evaluate the performance of protective coatings used to protect against corrosion. Important data relating to corrosion rate, polarization resistance and capacitance can be generated using EIS measurements. Research using both bulk electrochemistry and local electrochemistry research are used in this field. | Characterization of corroding metal impedance Learning Center article | Mass transfer limitation electrochemistry corrosion (application note) |
| Battery research and EIS | Impedance measurements can play a vital role in monitoring and controlling the degradation of battery performance in use as it can give information on the charge transfer resistance related to SEI, on the ohmic resistance of the electrolyte, on the diffusion constant of the inserted species. The cyclability, the efficiency of the battery can be optimized and monitored using EIS. | Why use EIS for battery research? | EIS high frequency internal resistance (battery applications - Application note) |
| Photovoltaics | EIS measurements at various DC voltages allow to generate Mott-Schottky plots, from which several critical characteristics of the semi-conductors can be generated as a function of the frequency: donor densities and flatband potentials. | N/A | Photovoltaic Characterizations: Polarization and Mott Schottky plot |
| Fuel Cell research and EIS | In fuel cells and electrocatalysis, EIS can be used to find the best catalysts, ie the materials or mixture of materials for which the fuel reaction (Oxygen Evolution Reaction or Hydrogen Evolution Reaction) is the most facile. Additionally, anything related to mass transport effects, for example what is the best partial pressure for a certain operation can also investiogated using EIS at lower frequencies. | N/A | Fuel Cell Testing Part II: EIS characterization (EIS characterization) |
| EIS in biology | Although the main uses of EIS are in corrosion and battery research, EIS is being used increasingly in biology and medicine with uses as diverse as study of tissues, research into antibody-antigen binding and the corrosion resistance of dental alloys in artificial saliva. |
Electrochemical Impedance Spectroscopy (EIS): A glossary of terms
| TERM | DEFINITION |
| Impedance | The frequency-dependent behavior of a system submitted to an electrical perturbation. Better said, it is the transfer function of a system, when the input signal is current and the output potential. |
| System | A system is a physical object with one or more inputs and one or more outputs |
| Electrochemical interface | An electrochemical interface is most often due to the presence of an electronic conductor (or semi-conductor) in an ionic conductor (solid or liquid electrolyte). The interface is where the charge transfer between both conductors occurs. |
| Electrical Equivalent Circuit | Electrical circuit built using electrical and electrochemical single elements, where each element represents a specific physical process or component of the system under study. |
| Faradaic impedance | The Faradaic impedance is derived from the Faradaic current, which is the current related to the electrochemical process occurring at the interface. |
| Capacitive current | The capacitive current is the part of the current which is related to the charge/discharge of the double layer capacitance, caused by the electrode/electrolyte junction. |
| Frequency | The inverse of time, also an important characteristic of any electromagnetic wave. |
| Steady-state | Also named permanent state, it is a non-transient state. If we wait sufficiently long, the steady-state should always be reached. |
| Time-variance | The property of a system for which its constitutive parameters change with time. |
| Linearity | A linear system verifies the property of superposition. It is a necessary condition for valid EIS measurements and interpretation. |
| Stationarity | Stationarity comprises steady-state and time-invariance. It is a condition where no parameters change with time. |
| Ohmic resistance | Series resistance related to any ohmic component in the system: electrolyte, electrical contacts, oxide layers etc |
| Double Layer Capacitance | Capacitance related to the potential difference between an ionic conductor and an electronic conductor, at the electrochemical interface. |
| Mass transport | Displacement of matter occurring by diffusion (concentration gradients), convection (forced flow) or migration (charged species under an electrical field). |
| Semi-infinite diffusion | Condition where diffusion occurs in an electrolyte with a homogenous concentration of the electroactive species |
| Bounded diffusion (convection-diffusion) | Condition where mass transport occurs by convection and diffusion with a change of the electroactive species concentration in the vicinity of the interface |
| Adsorption | Process where an element from a liquid or gaseous phase chemically bonds to a solid surface. It can be part of an electrochemical reaction (Volmer- Heyrovský). |
| THD | Total Harmonic Distortion, an indicator of the amount of non-linearity of the signal. |
| Complex number | Number that can be written under the form a +ib where i is the imaginary number so that i² = -1. Impedance is a complex number. |
| Nyquist representation | Representation of the impedance data where $\text{-Im}(Z)$ is plotted $vs.\; \text{Re}(Z)$ |
| Bode representation | Representation of the impedance data where $|Z|$ and $\phi(Z)$ are plotted $vs.f$ the frequency. |
| NSD | Non-Stationary Distortion, an indicator of the amount of non-stationarity in the signal. |
| NSR | Noise to Signal Ration an indicator of importance of the signal compared to its noise. |
| Inductance | Artefacts caused by the magnetic field induced by the current flowing in the leads. It is visible at high frequencies for systems with low impedance (batteries for example). It is also the impedance related to adsorption processes. |
| Charge transfer | Electron transfer between an electronic and an ionic conductor. |
| Drift correction | Tool available in EC-Lab® to correct the effect of non-stationarity on impedance data. |
Further reading
[12] Introduction to EIS using EC-Lab®
[13] Study of the insertion reaction
[14] Characterization of a corroding metal
[15] White Paper 1 – Studying batteries with EIS
[16] Application Note 62 – How to measure the ohmic resistance of a battery using EIS
[17] Application Note 63 – How to interpret lower frequencies impedance in batteries
[18] Application Note 71 – DC and AC characterization of a Vanadium Redox Flow Battery (VRFB) using a Pinflow 20 cm² test lab cell
[19] Application Note 32 – Fuel Cell Testing Part II: EIS characterization
[20] Application Note 66 – EIS measurements on a RDE Part I: Determination of a diffusion coefficient using the new element Winf
[21] Handbook of Electrochemical Impedance Spectroscopy. DIFFUSION IMPEDANCES – [PDF]
[22] Handbook of Electrochemical Impedance Spectroscopy. DISTRIBUTED and MIXED IMPEDANCES – [PDF]
[23] Handbook of Electrochemical Impedance Spectroscopy CIRCUITS made of RESISTORS and CAPACITORS – [PDF]
[24] Handbook of Electrochemical Impedance Spectroscopy. ELECTRICAL CIRCUITS CONTAINING CPEs – [PDF]
[25] Handbook of Electrochemical Impedance Spectroscopy Transfer functions – [PDF]
Electrochemical Impedance Spectroscopy (EIS) on the BioLogic Learning Center
BioLogic and ElS
A leader in Electrochemical Impedance Spectroscopy (EIS) technologies, BioLogic strives to place EIS within every researcher's reach, by making it available on all of its instruments. Integrated EIS makes the transition between AC and DC techniques smooth and flawless. Control techniques on AC sine waves can be superimposed on a DC potential or a DC current value. Additional techniques are also available that impose the sine wave on a varied potential (SPEIS, also known as the Mott Schottky technique) or a current (SGEIS) value.Finally, sequenceable EIS techniques can be applied to different defined conditions during the frequency sweep. Accuracy is given by the error observed on the phase of the impedance module to magnitude. Most of our potentiostats come with a specification of 1%, 1° accuracy below 500 kHz. With the SP-300 potentiostat providing the highest performance reading 0.3%,0.3°.


