

M470: An all in one scanning probe electrochemistry software
Latest updated: November 22, 2024The control software is integral to any scientific instrument, allowing at a minimum for the instrument to be configured and run. Although most focus is on the hardware, which has easily quantifiable specifications, the software is an important consideration to make. Although user experience and ergonomics are difficult to quantify, when these have not been addressed in the software your research can be hindered. BioLogic’s M470 software has been designed to ensure it works for you, with regular updates to ensure continued support. In this article we will introduce the M470 software, highlighting the ways in which it benefits you.
To illustrate the benefits of the M470 software we follow the workflow required to perform a Scanning Electrochemical Microscopy (SECM) experiment, from probe positioning to data analysis, as outlined in Fig. 1. Although we focus on SECM, many of the highlighted benefits are not specific just to SECM, they also carry over to the other experiment types.

Figure 1: The experimental workflow, from start to finish of an SECM experiment.
Full control of probe positioning
Once you have the SECM, or any scanning probe, experiment physically prepared the first step is to position the probe near the surface, and feature of interest you want to measure. Using the M470 software, you can move the probe to a position relative to its current position, using the manual control window, Fig. 2. This is useful for situations where the final position of the probe is not exactly known. You do not need to guess how far away the feature of interest is from the probe’s current position, instead you can just move it there with the push of a button. When more control is needed you can even change the velocity of the relative movement of the probe in a given direction. Of course, sometimes you know exactly where you want to position the probe, and when this is the case you can precisely move the probe by entering the absolute position required.

Figure 2: Manual stage control window.
Cyclic voltammetry for electrochemists
Once the probe is positioned the next step is typically to perform Cyclic Voltammetry (CV) at the probe, and, if required, at the sample. The M470 software is an all in one package containing not just the scanning probe electrochemistry experiments, but also electrochemistry experiments (including CV), corrosion experiments, and Electrochemical Impedance Spectroscopy (EIS) experiments, with options to analyse CV and EIS available. Configuration of these experiments is not compromised because you are using a scanning probe electrochemistry software. Instead, the configuration is exactly as you would expect from a potentiostat control software, with control of relevant experiment settings, and filtering options. Fig. 3 shows an example CV window.
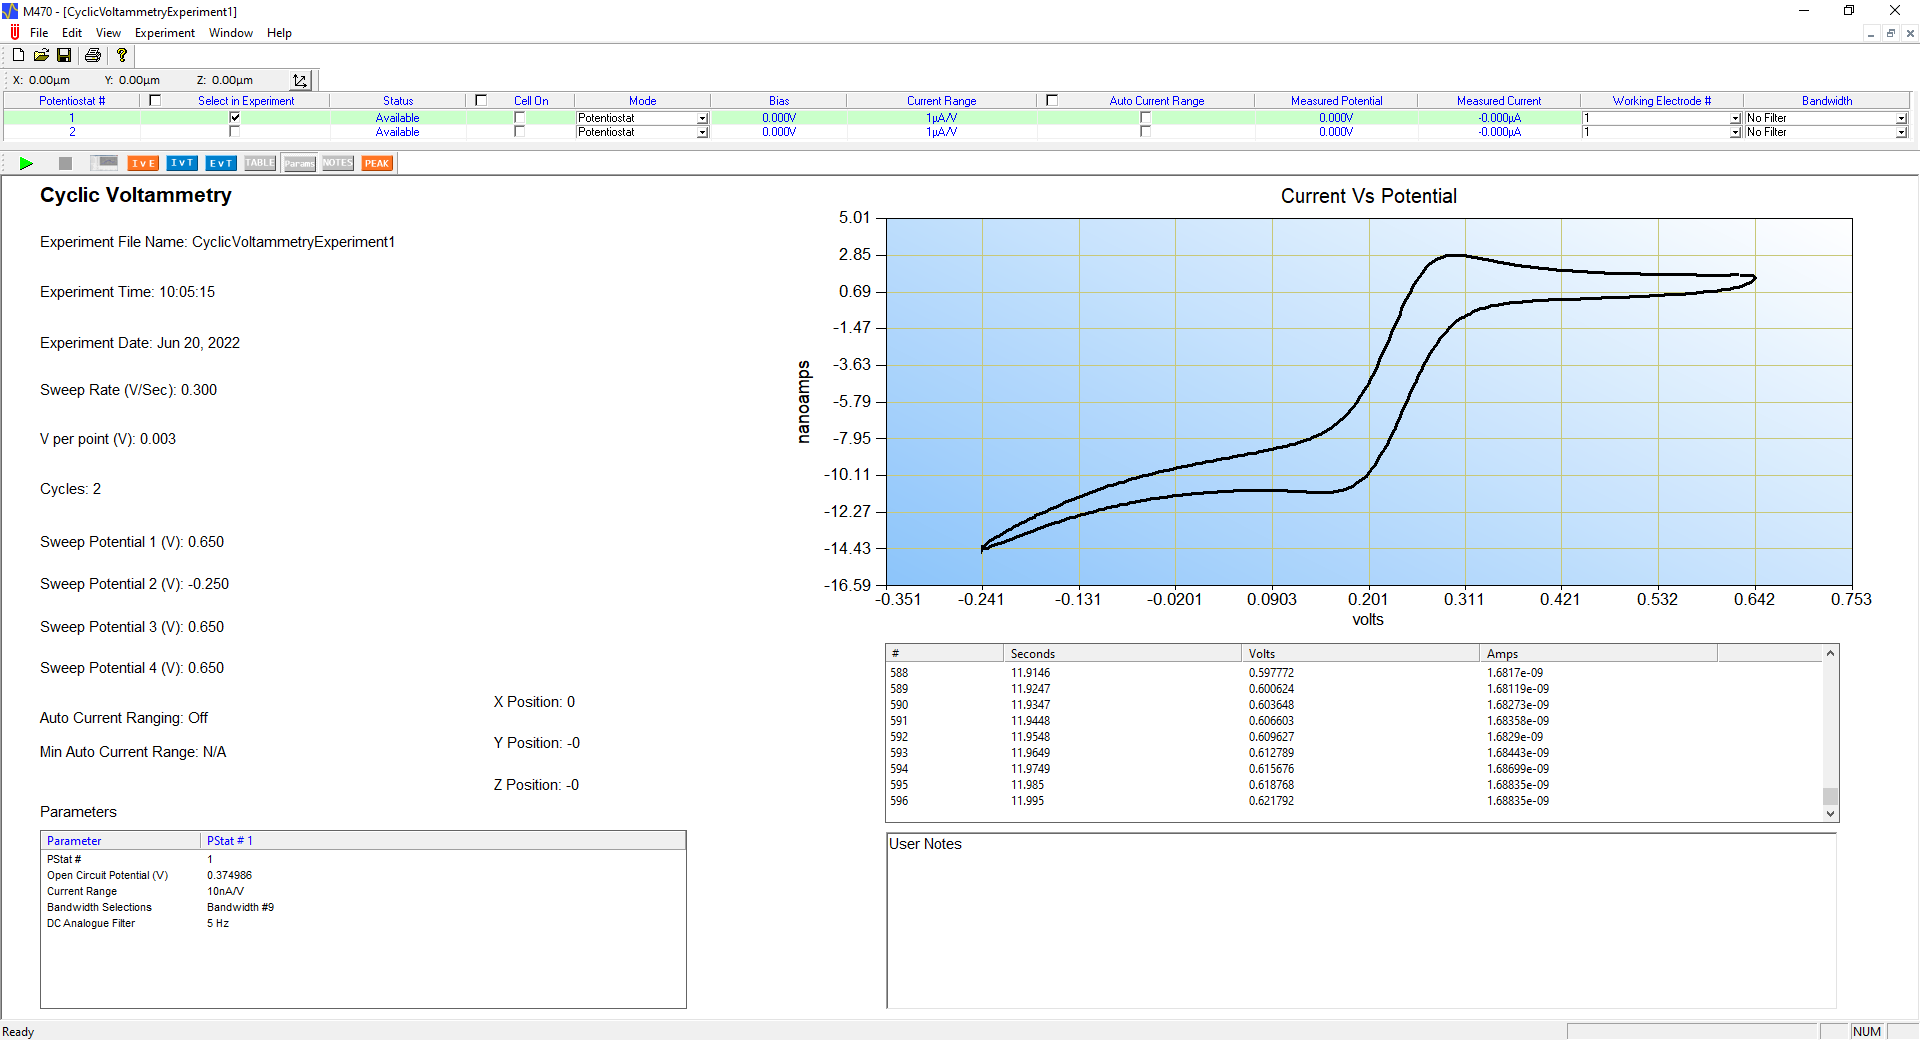
Figure 3: Window showing a CV experiment in the M470 software.
Approach curves with more control
Following the CV, an approach curve, or series of approach curves, is performed to determine the z position of the probe for an area scan. In the M470 software the approach curve exists as a standalone experiment type, with control of many parameters affecting the final experiment. During the configuration you can control the length of the approach curve, the step size used during the approach, and even separately control the velocity for the forward and reverse scan. While approach curves may be performed over a fixed distance, or until you manually abort the experiment, you can also take advantage of experiment triggers to automatically stop the approach. From the approach curve configuration, you can access two different types of experiment trigger: the Step Size Reduction Trigger, and the Experiment Terminate Trigger. The Step Size Reduction Trigger allows you to start the SECM approach curve using an initial, larger step size, and then as the probe moves close enough to the sample for the measured current to be affected, the step size will be reduced. The reduction is triggered when the current changes by a set percentage compared to its initial current. This reduces the required experiment time, by allowing you to work with a larger initial step size than without this trigger. As the probe moves closer and closer to the sample surface, the Experiment Terminate Trigger can then be used. In this case when the experiment changes by a larger percentage change compared to its initial current, the experiment will automatically terminate. This termination can also be set to trigger when the current reaches a specific absolute value. With this trigger, users can avoid contact between the probe and sample, which can be detrimental to the signal measured. Experiments can also be terminated after a consistent change, rather than through guess work. These different settings are illustrated for positive feedback in Fig. 4. To allow further flexibility you can set both trigger types independently for positive and negative feedback.
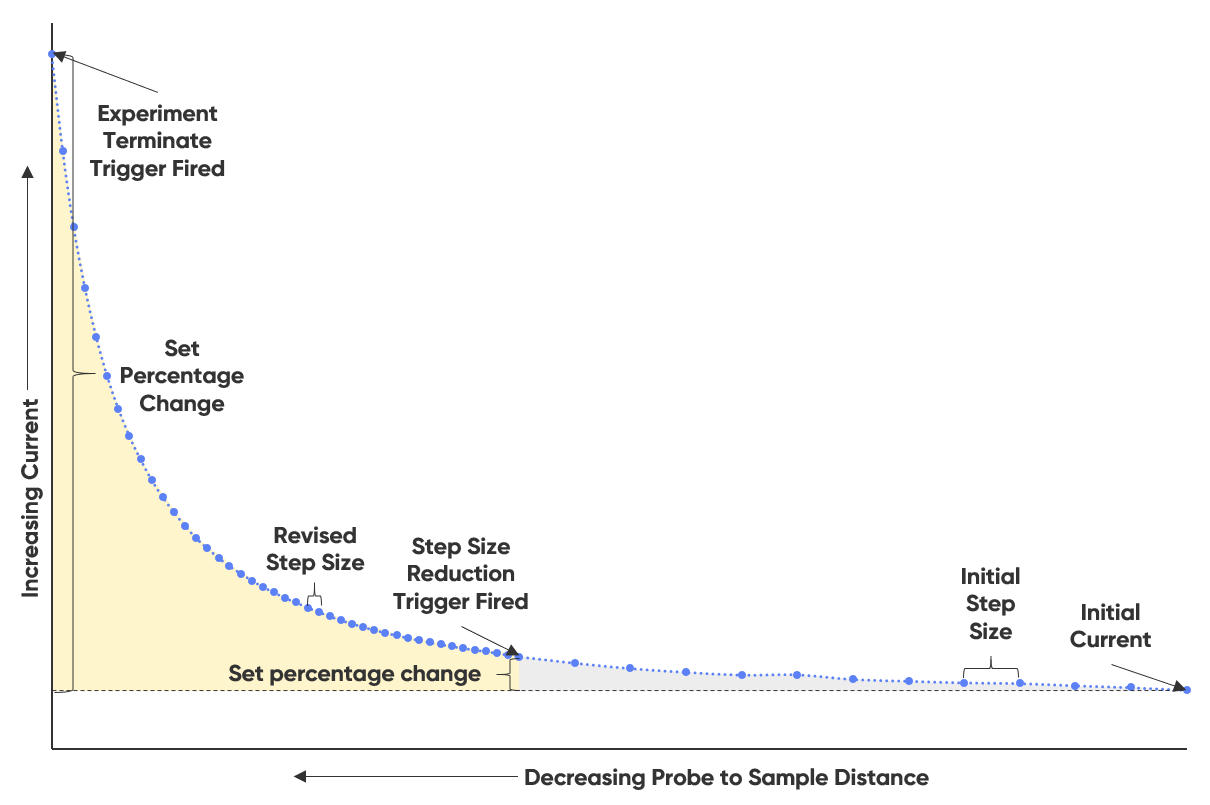
Figure 4: The relationship between the different approach curve settings and the final approach curve are illustrated for positive feedback.
A window showing an example approach curve experiment is shown in Fig. 5, note the full range of configurable parameters are not shown in this window.
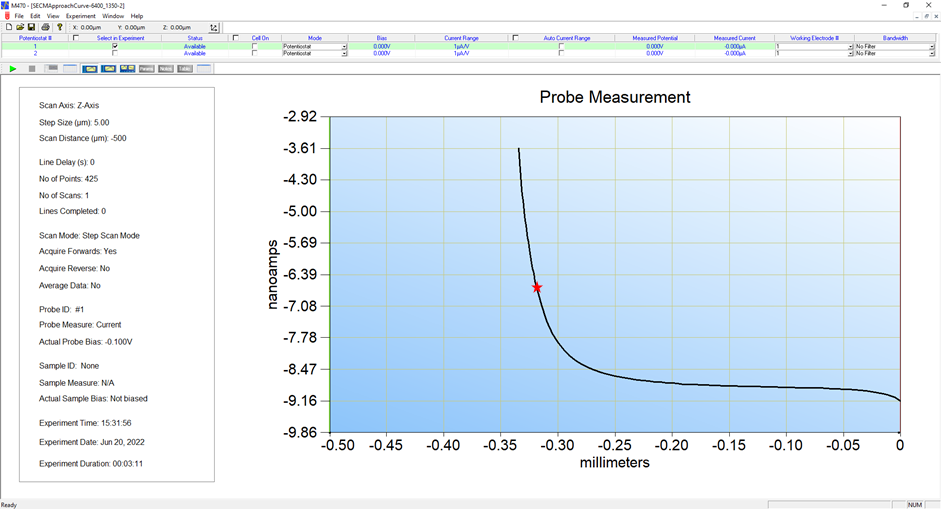
Figure 5: Window showing an approach curve experiment in the M470 software. The red star indicates where the Step Size Reduction Trigger occurred.
Tilt correction to better address demanding samples
The signal measured on SECM has a strong relation to probe to sample distance. If a sample is smooth, but has a background tilt the signal will be adversely affected. To counter this, BioLogic offers the Approach Curve Topography Extrapolation Experiment (referred to as Topography Extrapolation Experiment) to determine sample tilt. To use this, you collect approach curves at three different points across the sample surface and input these into the Topography Extrapolation Experiment, resulting in a map which can be used as the topography input for any SECM height tracking measurement. Because of the way this extrapolation works, it can be used over the entire measurement range of the instrument, allowing sample tilt to be countered for any size SECM area scan, big or small. An example of the Topography Extrapolation Experiment is shown in Fig. 6.
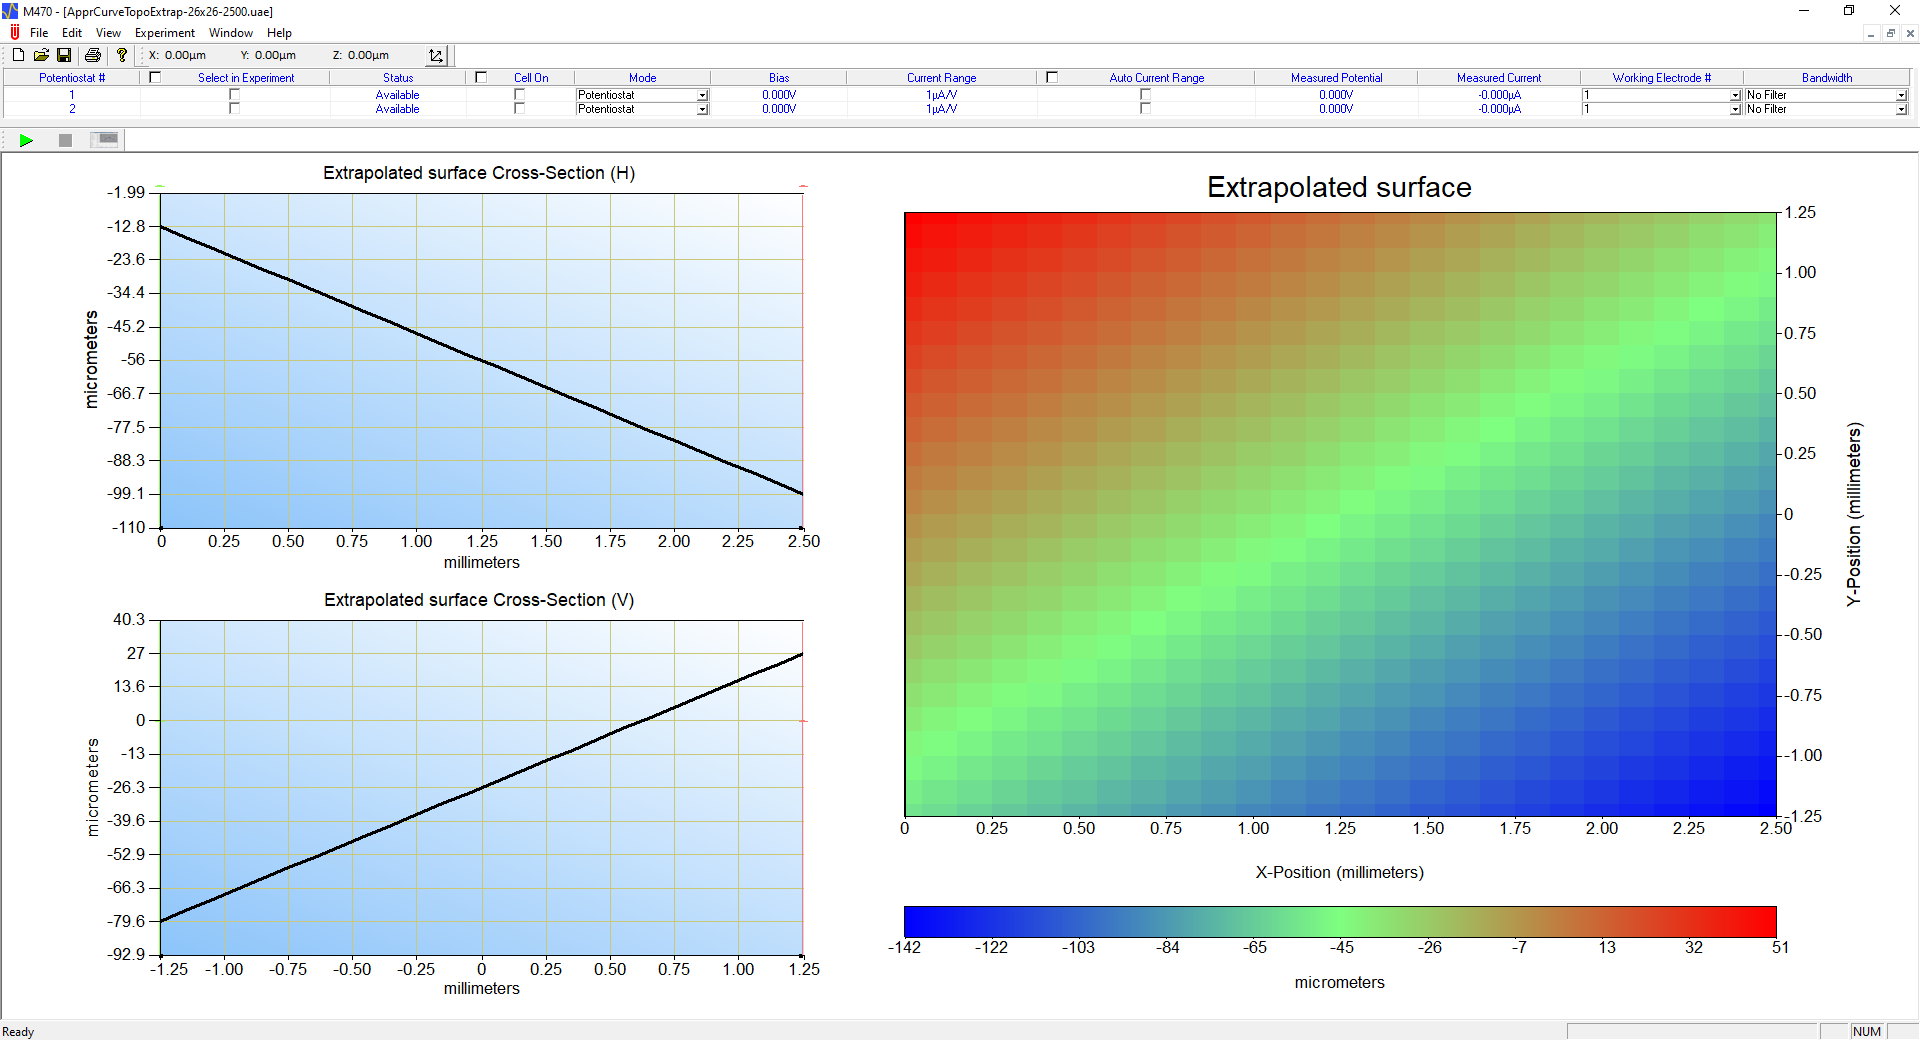
Figure 6: Window showing an Approach Curve Topography Extrapolation Experiment in the M470 software.
If you have a sample with background topography, that is not from sample tilt, we suggest using ic-SECM instead.
Fine tune the area scan
With the probe positioned and the sample tilt determined it is time to run the area scan. All area scans, SECM or otherwise, are their own distinct experiment types. You have full control of the potentiostat settings in the SECM area scan configuration, allowing not just the bias to be selected, but also selection of the filtering options. This is standard for M470 experiments requiring use of a potentiostat. From the configuration you can set distinct measurement lengths and step sizes in both the x- and y-direction, and the forward and return velocities can be set independently. When a dc-experiment is used you can select between step scan or sweep scan mode, allowing you to select for experiments with the highest quality data, or the shortest experiment time. When step scan mode is used, you can specifically set the number of samples and sample rate at each point, to further tune the measurement quality. Fig. 7 shows an example area scan, note the full range of configurable parameters are not shown in this window.
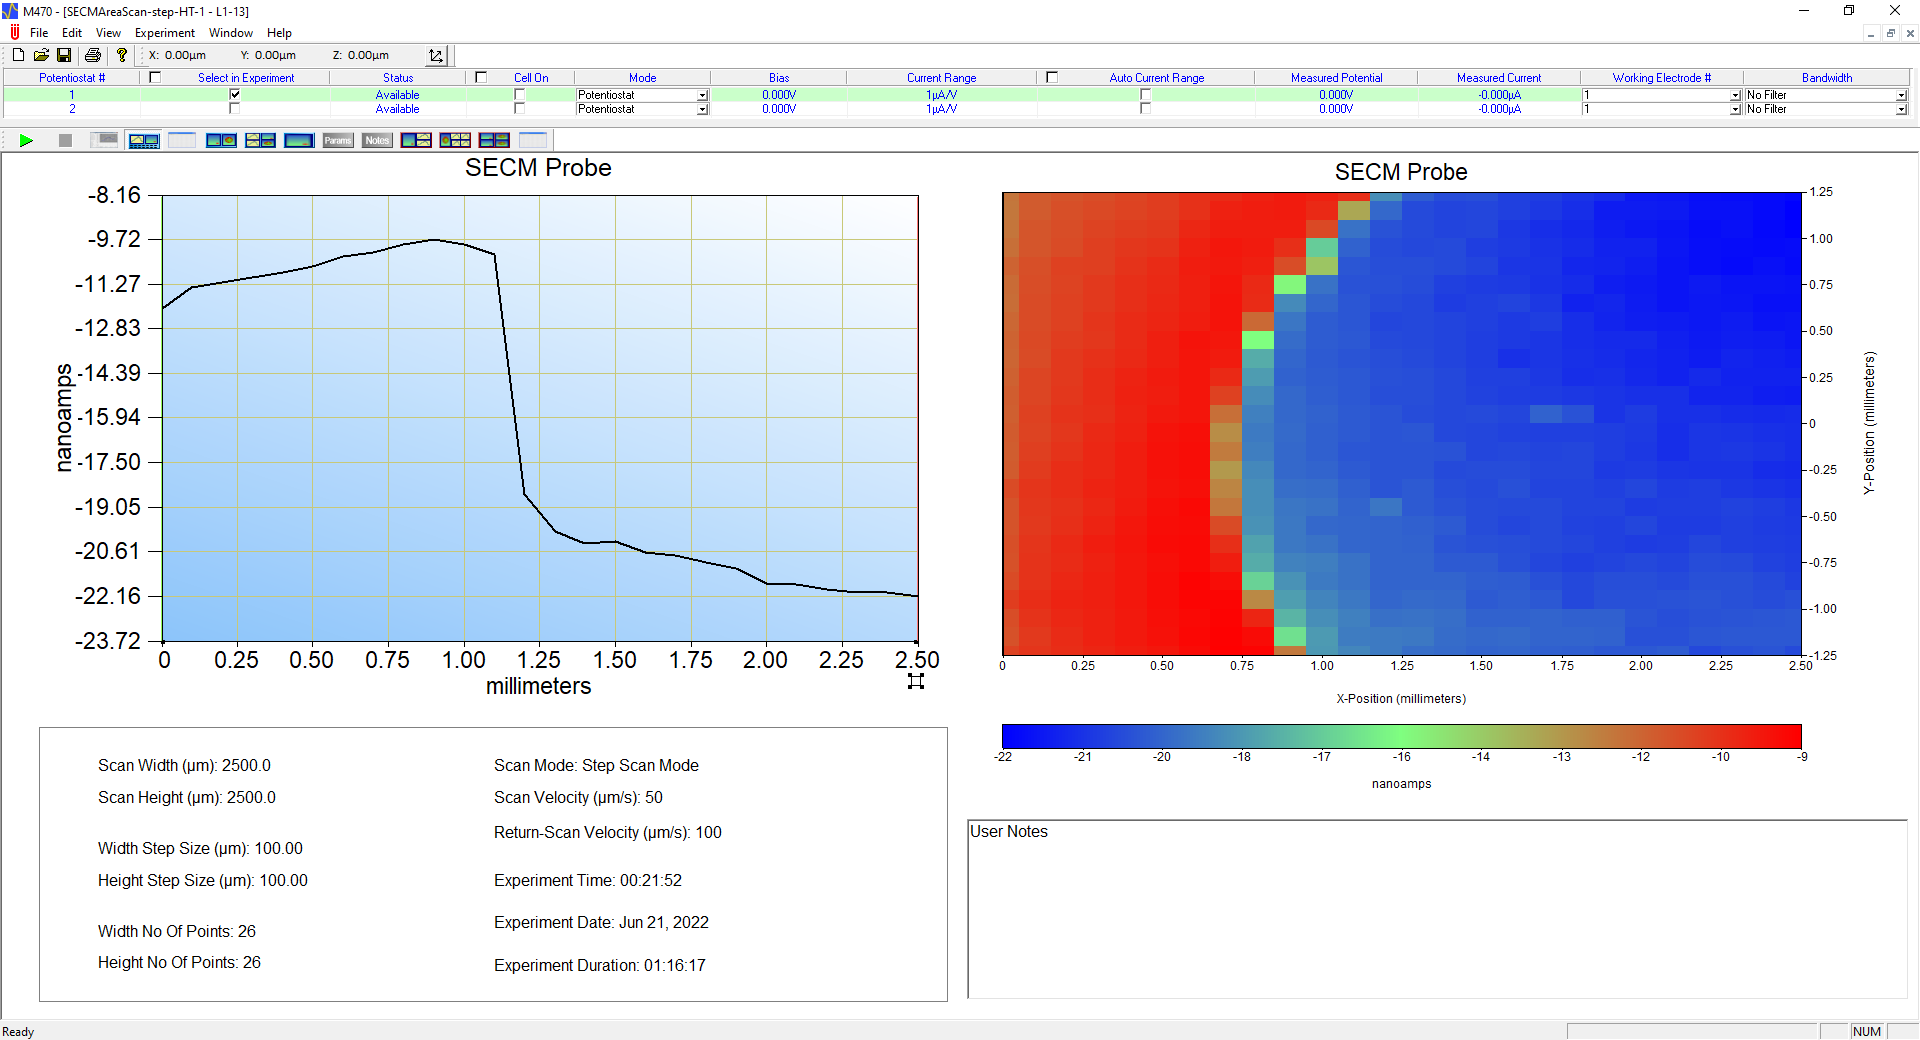
Figure 7: Window showing an example SECM area scan in the M470 software.
Processing and analysis
After the area scan is performed the work is not necessarily complete, processing and analysis of the data may also be required. The M470 software is an all in one software, offering a number of processing and analysis options. From the M470 software users can perform background correction, interpolation, addition and subtraction of maps, and more. Users can also alter the area graph properties with the ability to change the colour scheme and labels. Where more advanced processing and analysis options are required, users should consider 3DIsoPlot and MIRA.
If you would like more information on the processing and analysis options available in the M470 software, please see SCAN-Lab AN#4 and AN#8.
Sequencing for complex protocols and automation
When you have more advanced workflows, a complete sequencer is also available in the M470 software. The sequencer allows sequencing of all available experiments, from electrochemistry to area scans. You can also include logic steps, such as loops and probe movements, and the control of the SDS470 pump, and USB-PIO, to build more complex protocols. An example sequence from the M470 software is shown in Fig. 8.
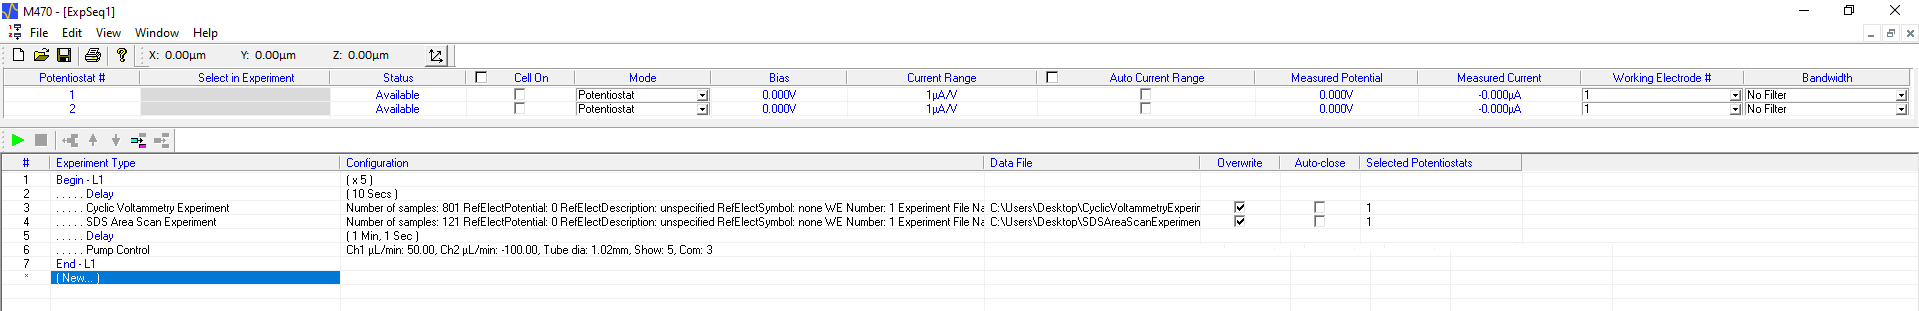
Figure 8: Window showing an example sequence in the M470 software.
Coupling with external devices
For experimental protocols which require the use of external devices, such as lamps or LEDs, you can use the M470 software with the USB-PIO accessory. The USB-PIO can be used to switch eternal devices from the software, using the sequencer and SECM Modular Map Experiment (MME).
Ever evolving. Ever improving.
To ensure you have the best experience the M470 software has regular updates, to correct bugs and importantly add functionality to the software. The scanning probe electrochemistry field continues to evolve with new functionality added to meet changing needs. These improvements are available to all users, and can be downloaded from our website.
Summary
The unique benefits of the M470 software are highlighted in Table 1.
| Strength | User benefit |
|---|---|
| Inclusion of Electrochemistry, Corrosion, and Electrochemical Impedance Spectroscopy experiments, with full configuration |
|
| Approach curve trigger options |
|
| Software tilt compensation |
|
| Independent measurement and return velocity |
|
| Control of sampling during scanning experiments |
|
| Wide range of analysis functions |
|
| Sequencing |
|
| Ease of use |
|
| Regular software releases with lifetime updates |
|


