

Which SCAN-Lab software should I use?
Latest updated: November 18, 2024Because the software is just as important to the scanning probe electrochemistry experiment as the hardware, BioLogic offers three different software options in relation to the M470: M470, 3DIsoPlot, and MIRA. These three pieces of software each fit a different role for the end user. In this article we outline the different software, to help you decide which to use when.
The control software: M470
When performing any experiment, not just scanning probe electrochemistry experiments, some software is required to control the instrument, configure, and run and follow experiments. By its very nature the instrument control software is intensively used. If the control software is difficult to use, end users may be deterred from actively using the instrument. In these cases when the instrument is used, it may be limited to no more than the most basic of experiments.
This is the role filled by the M470 software which is used to control all aspects of the M470, run and follow bulk and scanning probe electrochemistry experiments, and collect and display data. Furthermore, the M470 software offers a number of post processing and analysis options. An example area scan from an Optical Surface Profiler (OSP) measurement of a Euro coin as measured and displayed by the M470 software is shown in Fig. 1.
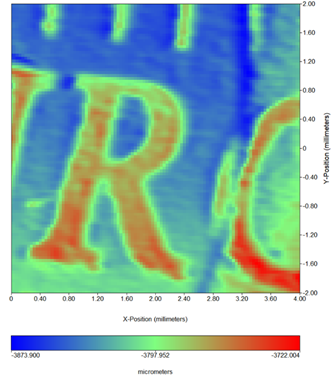
Figure 1 : OSP area scan of a Euro coin as measured and displayed by the M470 software.
Because the user experience is so important, the M470 software is purposely designed for high ease of use, for both novice and experienced users. Even with minimal experience performing scanning probe electrochemistry techniques, the M470 software contains all of the information needed to begin a basic experiment. On the other hand, if you have a lot of experience of scanning probe electrochemistry you can access advanced settings required to fully tune your experiments, and even build more complex protocols through the use of the experiment sequencer.
The M470 software is required for users to work with the M470 scanning electrochemical workstation, as such it is supplied with the base instrument. Although supplied at time of purchase, regular updates to the M470 software occur, which are included for all existing users, ensuring end users always benefit from the updates we make. The inclusion of a number of post processing and analysis functions means that in most cases the M470 software is all you will ever need. For cases where more functionality is required, however, 3DIsoPlot and MIRA can also be considered.
The 3D projection software: 3DIsoPlot
When a scanning probe electrochemistry experiment is performed it is important that the data is displayed in a way that is easy to interpret. Presenting area scan data as a 3D projection is one way to accomplish this.
Using 3DIsoPlot, you can directly convert the 2D projections produced in the M470, and other SCAN-Lab, software, to striking 3D projections. 3DIsoPlot does more than just produce 3D projections though, it also offers you full control of the 3D settings, including lighting, camera angle, render type and more, to further highlight features of interest. An example OSP area scan of a Euro coin as displayed in 3DIsoPlot is shown in Fig. 2.
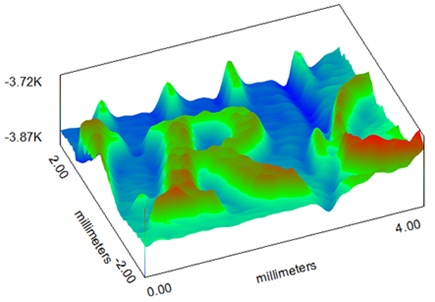
Figure 2 : OSP area scan of a Euro coin as measured by the M470, and displayed in 3DIsoPlot.
Further information on the use of 3DIsoPlot can be found in SCAN-Lab AN#12: 3D Map production using the 3DIsoPlot software.
The advanced representation and SECM analysis software: MIRA
MIRA is an optional software available for use with the M470, and other SCAN-Lab instruments. MIRA allows for data representation, and Scanning Electrochemical Microscopy (SECM) approach curve fitting.
Data representation
As discussed for 3DIsoPlot the ability to flexibly represent scanning probe electrochemistry data can be highly beneficial. MIRA is another option available to users to present data in different ways. Using MIRA not only can you present area maps as 3D projections, you can directly convert this data into a range of 2D heat maps, and contour maps giving you further control over how your data is represented. An example OSP area scan as displayed in MIRA is shown in Fig. 3.
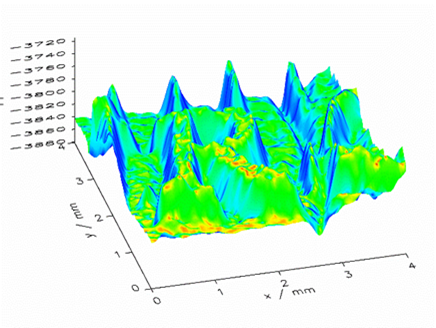
Figure 3 : OSP area scan of a Euro coin measured by the M470, and then displayed in MIRA.
Fitting of the SECM approach curve
When performing SECM the approach curve can be analyzed to extract physicochemical parameters related to the system under study. To do so the approach curve is fit to one of a number of theoretical models. This can be a time-consuming process requiring complex mathematical models to be built.
Using MIRA you bypass the need to build models to fit SECM approach curves, which can be difficult and lengthy. MIRA has over 10 different models from the literature to choose from to fit the approach curve. With MIRA you can fit the approach curve without requiring any other information, or if some parameters are known, like the probe diameter, you can enter these to achieve a more accurate fit. The SECM approach curve fitting tool, shown in Fig. 4, is an especially powerful use of the MIRA software, allowing users to determine variables including, but not limited to, RG ratio, and distance of closest approach, and even display the approach curve on normalized coordinates.
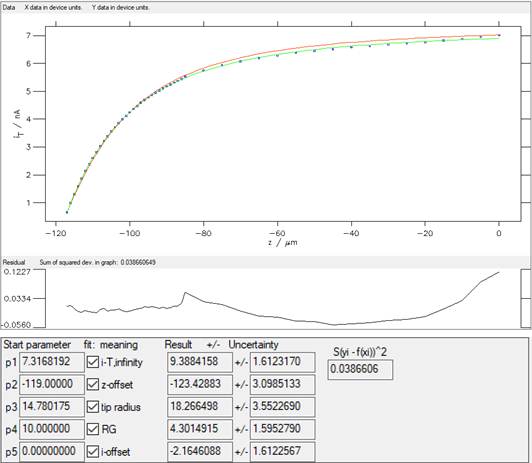
Figure 4 : The approach curve fitting tool available in MIRA is shown.
Further information on the use of MIRA can be found in SCAN-Lab AN#5: Introducing the Microscopic Image Rapid Analysis (MIRA) software.
When to use each software?
As we have outlined each software available has a different set of uses. The M470 software is used primarily for instrument control, including the configuration and running of experiments, and data display, however it also has a number of basic post processing and analysis options. MIRA can also be used for post processing and analysis, as well as to fit SECM approach curves, and additional representation of data measured by the M470. Finally, 3DIsoPlot is used when 3D projections of area maps are required, especially when users would like full control over the map properties. This is summarized in Table 1.
Table 1 : The uses of the three SCAN-Lab software are summarised and compared.
| M470 | 3DIsoPlot | MIRA | |
|---|---|---|---|
| Use | Control the M470, run and follow experiments, collect data, and perform basic analysis and processing. | Production of 3D projections, with full 3D imaging capabilities (e.g. materials, lighting, etc.). | High level approach curve fitting. Basic data post processing, and presentation as 2D and 3D projections. |
| Post processing | Basic | None | Basic |
| Analysis | Limited | None | Yes |
| 3D projections | None | Yes | Yes |
| Techniques | All | All | All, with particular benefits for SECM |
Added in 04/2023


