

3D Map production using the 3DIsoPlot softwareScanning Probes – Application Note 12
Latest updated: June 13, 2024Abstract
BioLogic offers the optional 3DIsoPlot software to convert data produced on Scan-Lab instruments, as well as modeled data, into 3D maps. In this note, 3DIsoPlot has been used to produce 3D maps from three different samples, with the aim of providing the knowledge necessary to start using 3DIsoPlot to render 3D maps.
Introduction
The construction of 3D maps from SPM measurements can help results have a strong impact on an audience. To this end Bio-Logic offers the optional 3DIsoPlot software to convert data produced on Scan-Lab instruments, as well as modelled data, into 3D maps. In this note 3DIsoPlot has been used to produce 3D maps from three different samples, with the aim of providing the knowledge necessary to start using 3DIsoPlot to render 3D maps.
Samples
Throughout this note three different samples will be used to demonstrate the capabilities of the 3DIsoPlot software. These samples are:
- A piece of patterned copper tape measured by dc-SECM in 1 mM [Fe(CN6)]3-/[Fe(CN6)]4- / 100 mM KCl.
- A gold micron dot array, provided by ELISHA Systems, measured by dc-SECM in 10 mM [Fe(CN6)]3-/[Fe(CN6)]4- / 100 mM KCl.
- A nano-patterned gold sample measured by ic-ac-SECM in 100 mM TBA-ClO4 (tetrabutylammonium perchlorate) in PC (propylene carbonate).
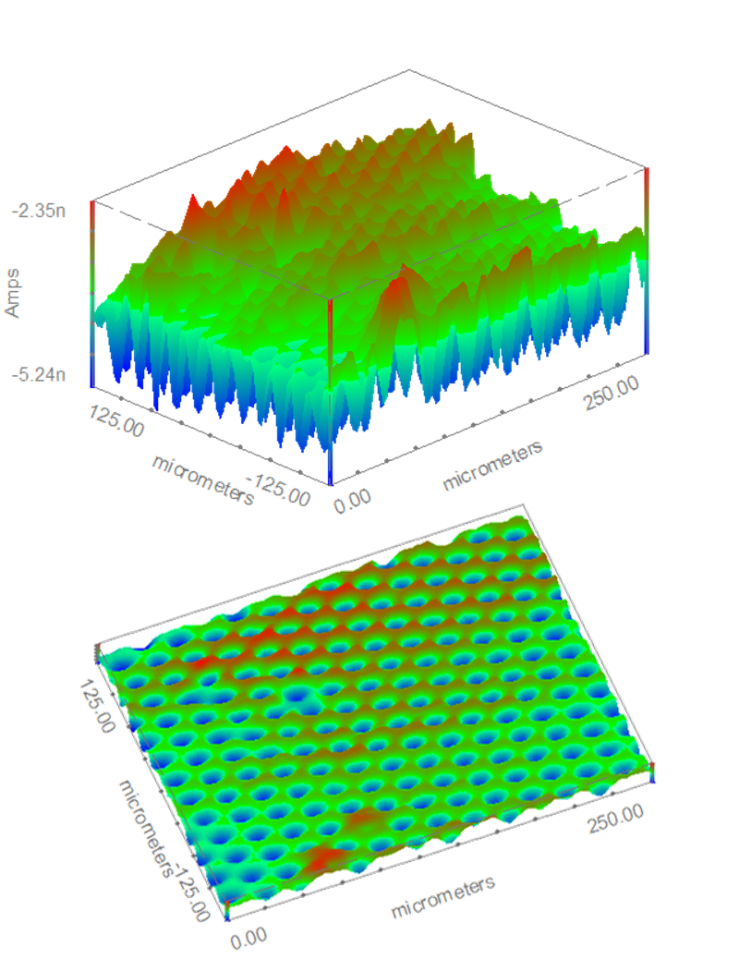
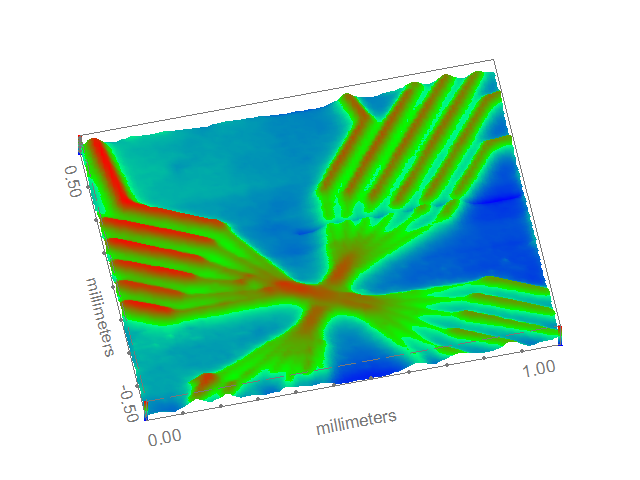
Both the area maps from the copper tape and nano-patterned gold sample were tilt-corrected, and filtered with a low-pass 10,000 per meter cut-off filter in the M470 software. The area map from the micron dot array was used without any correction. More information on using the graphical and analysis tools of the M470 software can be found in Application Notes #4 and #8. [1 and 2] Figure 1 shows the original area maps for each sample.
![(a) Patterned copper tape measured in 1 mM [Fe(CN6)]3-/[Fe(CN6)]4- / 100 mM KCl. (b) Gold micron dot array from ELISHA Systems measured in 10 mM [Fe(CN6)]3-/[Fe(CN6)]4- / 100 mM KCl. (c) Gold nano-patterned sample measured in 100 mM TBA-ClO4 in PC.](data:image/svg+xml;base64,PHN2ZyB4bWxucz0iaHR0cDovL3d3dy53My5vcmcvMjAwMC9zdmciIHdpZHRoPSIzNDciIGhlaWdodD0iOTI4IiB2aWV3Qm94PSIwIDAgMzQ3IDkyOCI+PHJlY3Qgd2lkdGg9IjEwMCUiIGhlaWdodD0iMTAwJSIgc3R5bGU9ImZpbGw6I2NmZDRkYjtmaWxsLW9wYWNpdHk6IDAuMTsiLz48L3N2Zz4=)
Figure1: (a) Patterned copper tape measured in 1 mM [Fe(CN6)]3-/[Fe(CN6)]4- / 100 mM KCl. (b) Gold micron dot array from ELISHA Systems measured in 10 mM [Fe(CN6)]3-/[Fe(CN6)]4- / 100 mM KCl. (c) Gold nano-patterned sample measured in 100 mM TBA-ClO4 in PC.
![(a) Patterned copper tape measured in 1 mM [Fe(CN6)]3-/[Fe(CN6)]4- / 100 mM KCl. (b) Gold micron dot array from ELISHA Systems measured in 10 mM [Fe(CN6)]3-/[Fe(CN6)]4- / 100 mM KCl. (c) Gold nano-patterned sample measured in 100 mM TBA-ClO4 in PC.](https://biologic.net/wp-content/uploads/2019/08/scanan12f1.png)
Getting Started
All area maps measured using the M370 and M470 software are compatible with the 3DIsoPlot software. These can be directly opened in 3DIsoPlot without having to export or convert the files. When opening a file the user can view specific experiment types, or select ‘All Files’ to view all experiment types. 3DIsoPlot also allows .txt, and .bmp files to be opened, meaning the software can be used with modelled data and third party software.
If the opened file contains more than one area map type the user will be prompted to select the area map to open, as shown in Figure 2.

Figure 2: If a file contains multiple area maps the user will be prompted to select a specific map.
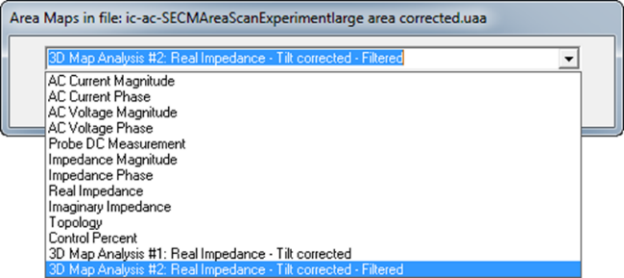

Figure 3: The Window dropdown menu allows a variety of views of the data to be selected.
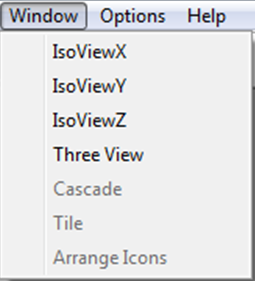
Window Menu
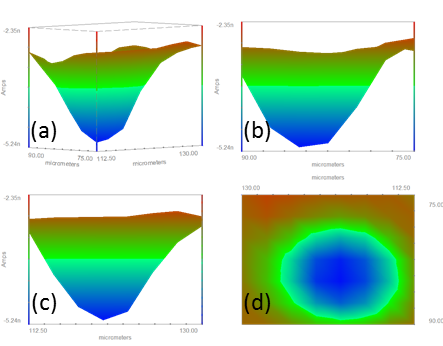
On opening an area map in 3DIsoPlot it defaults to an isometric view. Using the Window menu (Figure 3) it is possible to view the 3D map from the X (IsoX), Y (IsoY), and Z (IsoZ) axis. This is demonstrated using a small area of the micron dot array in Figure 4.

Figure 4: (a) Isometric, (b) IsoY, (c) IsoX, and (d) IsoZ views of a cropped view of the gold micron dot array.
Options Menu
The Options menu (Figure 5) contains the majority of the necessary functions to render a 3D map from the M370/M470 software. Most important in this menu is the 3D Properties option which will be discussed in detail in the following section.

Figure 5: The Options menu allows selection of many of the functions needed to render a 3D map.
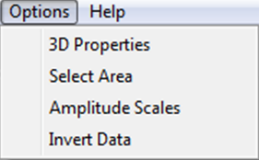
Select Area can be useful in cropping an area map to focus on the most interesting areas, enhancing the visual impact of the area map. Selecting the Amplitude Scales option allows the amplitude scale of the map to be selected, as in the M370/M470 software. This is useful for adjusting the scaling to exclude noise and other outliers. Invert Data changes the sign of the data, flipping it on the Z scale. This can be beneficial for making the probe output, i.e. current or impedance, match the sample topography. The use of these tools can be seen in Figures 6 and 7.

Figure 6: Prior to forming a 3D map from the area map of the copper tape a smaller area was first selected, and the amplitude scale was changed allowing focus on the area of interest.
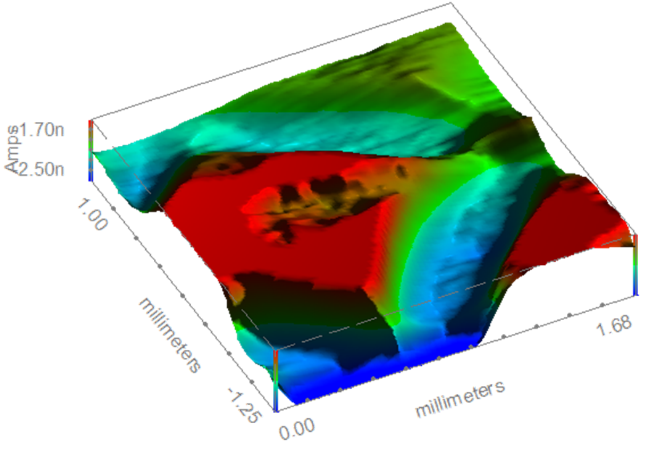

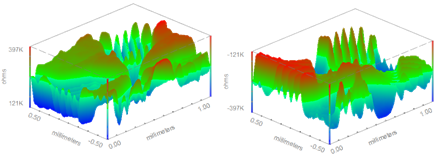
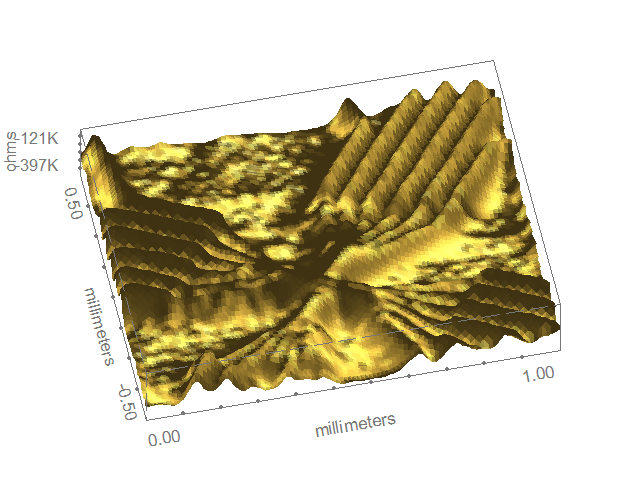
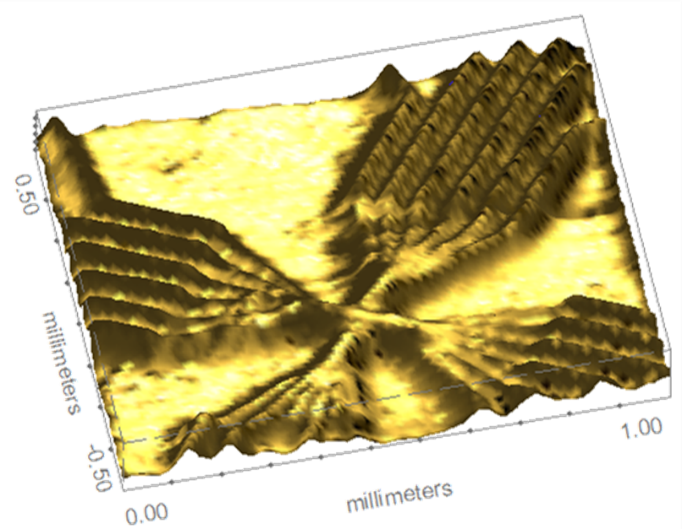
Figure 7: The original data for the nano-patterned gold sample (left) was inverted (right) to reflect the known topography of the sample.
3D Properties
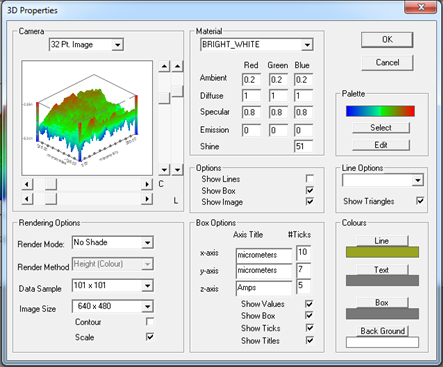
The 3D Properties menu, Figure 8, is the most important menu available in the production of a 3D map. This menu allows the angle of the map, the shading, the rendering process and more to be altered.

Figure 8: The 3D Properties menu allows the user to control the camera and lighting angles of the map, the material properties and colour palette of the map, and the rendering style of the 3D map.
Camera
The Camera submenu allows the quality and style of the image, the camera angle and the lighting angle of the 3D map to be selected. The 3D Properties menu in Figure 8 shows the default Camera options on opening an area map. The resolution of the image can be altered to make it quicker to render, though this will reduce the resolution. The 32 Pt default is the highest resolution image, and unless stated has been used for all images in this note. While the program defaults to show the fully rendered image, a line plot is also possible, Figure 9. The camera angle may need to be altered from the default to allow the topography of the 3D image to be properly highlighted. By changing just the camera angle a user can go from the top to the bottom image in Figure 10, quickly drawing attention to the features of the gold micron dot array.

Figure 9: A 32 Pt. resolution 3D line plot of the patterned copper tape.
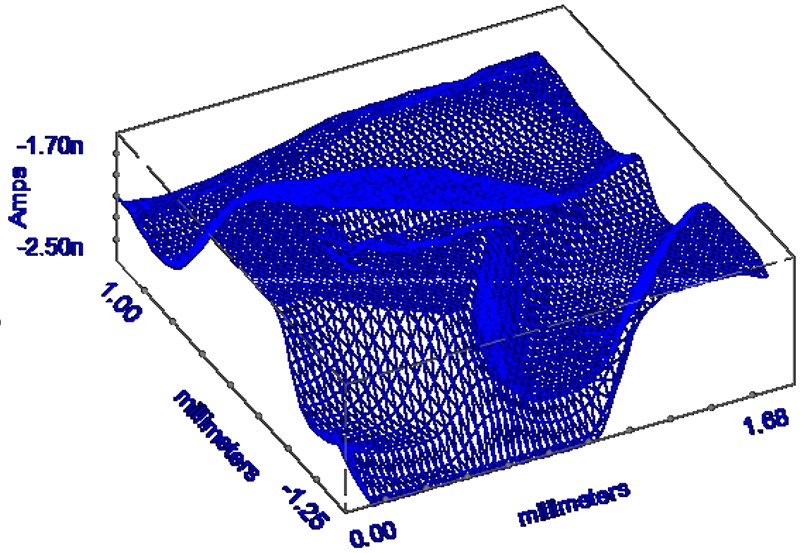

Figure 10: (Top) The original 3D map resulting from the area scan of the gold micron dot array. (Bottom) The same map after ONLY the camera angle has been changed.
Rendering Options
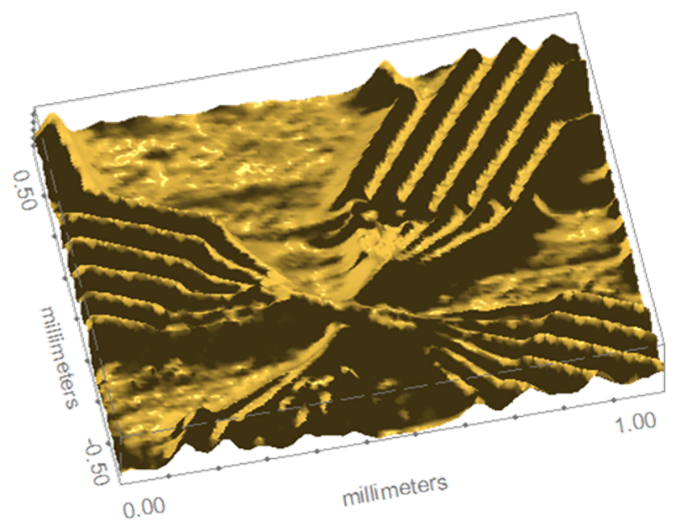
The 3DIsoPlot software allows for 4 different rendering options. These options will be demonstrated using the nano-patterned gold sample. All examples shown have been rendered with the Gold material type. This can be changed to one of a predetermined series of materials in the Materials submenu, or edited by the user.
No Shade
No shade is the default rendering option on opening a map in 3DIsoPlot. In this rendering style each polygon making up the 3D map is coloured based on the average Z value of its border. The palette of this shading can be set by the user. The lighting cannot be changed with No Shade rendering. This option is demonstrated in Figure 11.

Figure 11: The 3D map of the gold nano-patterned sample has been rendered using the No Shade option.
Flat
In Flat rendering flat panelled polygons of uniform colour compose the 3D map. Unlike the No Shade option, shading, lighting, and material properties are accounted for in the final map. This is the simplest of the rendering options accounting for these. Flat rendering has been used in Figure 12.

Figure 12: The Flat rendering option has been used to produce the 3D map of the gold nano-patterned sample.
Gouraud
Gouraud shading adds a degree of complexity to the Flat shading and interpolates the polygons. Interpolation of the polygons allows them to take on some shape producing a better map. The effect of Gouraud rendering is seen in Figure 13.

Figure 13: Gouraud shading was used in rendering the 3D map of the gold nano-patterned sample.
Phong
Building on the complexity of Gouraud rendering Phong rendering also interpolates light intensity. While this is the most computationally intensive rendering technique, it results in a more realistic image type. The use of Phong rendering is seen in Figure 14.

Figure 14: The 3D map from the gold nano-patterned sample was rendered using Phong rendering.
Render Method
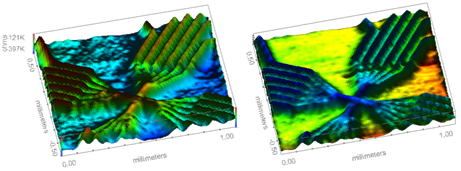
While the previous examples have shown the 3D maps rendered based on a specific material type it is also possible to render the image based on height or distance from the viewer. The resulting image from this can either be in grey scale or colour, based on either a default or user selected palette. This is demonstrated using the colour palette for the gold nano-patterned sample in Figure 15.

Figure 15: The 3D map of the gold nano-patterned sample has been rendered with Flat shading and the colour scale based on the feature height (left) and distance from the viewer (right).
Conclusion
This application note has aimed to introduce the M370/M470 user to the 3D mapping capabilities of 3DIsoPlot. An overview of the initial steps necessary for a user to transform the 2D area maps produced in the M370/M470 software into 3D maps has been presented. To obtain more information about the features available and how to use the 3DIsoPlot software the 3DIsoPlot manual should be consulted. Bio-Logic may also be contacted for more information on 3DIsoPlot and its use.
Acknowledgements
The nano-patterned gold samples used in this work were prepared by Dr. Jaroslaw Syzdek (Bio-Logic USA LLC) in the Marvel Nanolab facility at University of California, Berkeley.
The gold micron dot array measured in this work was provided by Professor Paul Millner ELISHA Systems director, and Professor of Bionanotechnology at the University of Leeds.


