

Introduction to the USB-PIO: measuring the effect of light on a live leaf Scanning Probes – Application Note 15
Latest updated: June 14, 2024Abstract
This application note uses SECM to investigate the effect of switching a blue LED (Light Emitting Diode) on and off on a living plant leaf. To switch the LED the USB-PIO accessory was used. The use of the USB-PIO has allowed the effect of both switching the blue LED over a sequence of experiments and during a Modular Map Experiment, to be investigated.
Introduction
Shortly after the introduction of SECM its use to investigate plants was demonstrated by Lee et. al. [1] A few years later it was shown that SECM could be used to investigate living plants [2]. Since these works SECM has been used in a number of investigations of plants [3], proving particularly useful in the investigation of plant stomatal activity [2-4].
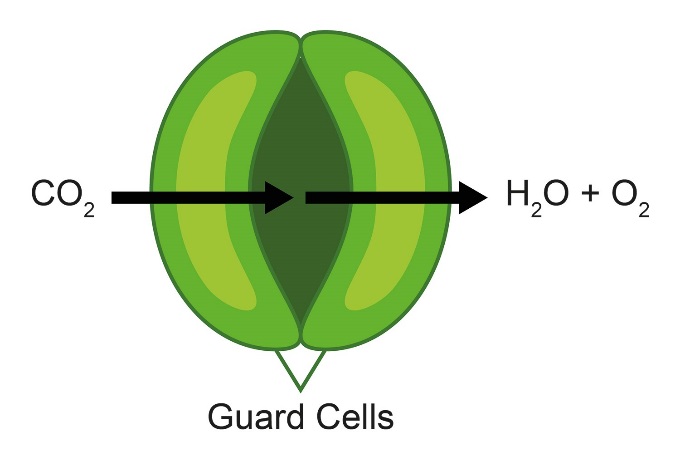
The plant stomata, Fig. 1, help regulate the ingress of CO2 for photosynthesis, and the loss of the O2 and H2O by-products. One of the many factors affecting the opening and closing of the stomata is light and its intensity. The stomata themselves are opened and closed by the surrounding guard cells. When the stomata are open the guard cells are turgid and have a higher topography than the surrounding area, they relax on stomata closing and their topography is lower than in the turgid state [5]. This means that when using SECM to investigate the effect of light on a live plant leaf two different effects can be detected: (1) A change in current due to changing O2 concentration. (2) A change in current due to the changing topography around the stomata.

Figure 1: Schematic of the plant stomata. The guard cells open and close the stomata to allow the ingress of CO2 and egress of H2O and O2.
This application note uses SECM to investigate the effect of switching a blue LED (Light Emitting Diode) on and off on a living plant leaf. For this work the leaf of a living spider plant (Chlorophytum comosum variegata), a common houseplant, was measured. To switch the LED the Universal Serial Bus – Parallel Input Output (USB-PIO) accessory (Product Number: xxx) was used. The use of the USB-PIO has allowed the effect of both switching the blue LED over a sequence of experiments, and during a modular map experiment to be investigated.
Using The USB-PIO
The USB-PIO is shown in Fig. 2. It is an optional accessory for the Scanning Electrochemical Workstation designed to switch external devices, such as a low voltage lamp or LED, from within the Scanning Electrochemical Workstation Software. It is powered by the USB which connects it to the PC, and contains a DB25 female pin to allow it to interface with user cables, or the provided cable and break out PCB. The USB-PIO can be used to control up to four different channels individually or collectively.
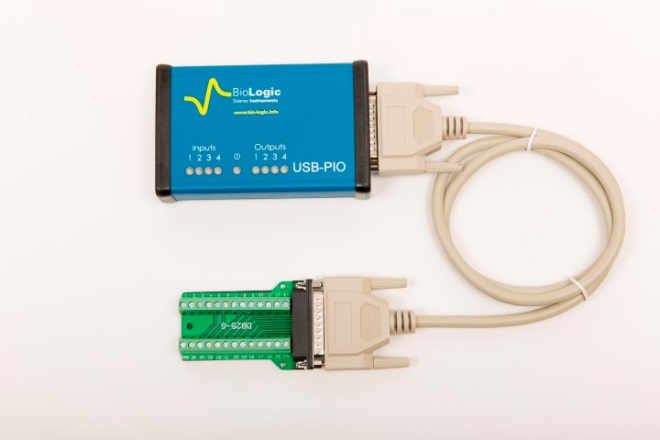
Figure 2: The USB-PIO connected to the supplied break-out PCB. This image is representative only. The user should ensure their break-out PCB is correctly housed for their experimental setup.
Control of the USB-PIO in an experiment can be performed in one of three ways:
- When no experiments are open the USB-PIO can be written to from the “Parallel I/O” option in the “Experiment” drop down menu, Fig. 3a.
- An experimental sequence can be written which allows the outputs of the USB-PIO to be switched between distinct experiments, Fig. 3b. This allows the USB-PIO to be used with any experiment which the user can sequence.
- A dc-SECM based modular map experiment can be performed. In this the USB-PIO outputs can be switched, or the inputs can be read from, during the sequence of events at each individual x-y point before moving to the next. This is programmed in the “Sequence of Events” menu in the “Modular” tab, Fig. 3c.

Figure 3: The USB-PIO can be controlled in one of three ways in the Scanning Electrochemical Workstation Software. (a) As a standalone experiment from the “Experiment” drop down menu. (b) As a “Logic” step in an experimental sequence. (c) As part of the sequence of events during a MME.
The use of the USB-PIO in a modular map experiment differs from its use in sequenced experiments in that it allows the user to write to, or read from, the USB-PIO at each individual point, rather than running an entire area scan experiment between each change in the USB-PIO. This allows the user to have confidence that the changes measured are due to the device they are controlling with the USB-PIO rather than the drift or fouling which can occur over the duration of an entire area scan measurement. The use of the USB-PIO in sequence, and in a MME are compared in Table 1.
Table 1: Comparison of using the USB-PIO in sequence vs. using it in a MME.
| Use of the USB-PIO in Sequence | Use of the USB-PIO in MME |
|---|---|
| Write only | Write and read |
| Can be used with any experiment which can be put into a sequence | Can only be used for step scan dc-SECM type experiments |
| Change in USB-PIO channel is applied for the duration of an experiment | Change in USB-PIO channel is applied at each individual x-y point |
| More than just the effect of the USB-PIO may be seen (e.g. thermal drift) | Short duration means only the effect of USB-PIO seen |
This application note aims to demonstrate the use of the USB-PIO with sequenced SECM experiments and the MME experiment.
Method
A beaker was mounted on the bottom plate of the Micro TriCell, allowing it to be levelled with the legs of the Micro TriCell base. A spider plant leaf was then mounted in the beaker, while still attached to the plant, so the bottom of the leaf was facing up, as the highest density of stomata are on this side [5]. It was held in place with a silicon tube ring. A schematic of the setup is seen in Fig. 4.

Figure 4: Schematic of the experiments on the spider plant leaf investigating the effect of turning on and off a blue LED using the USB-PIO.
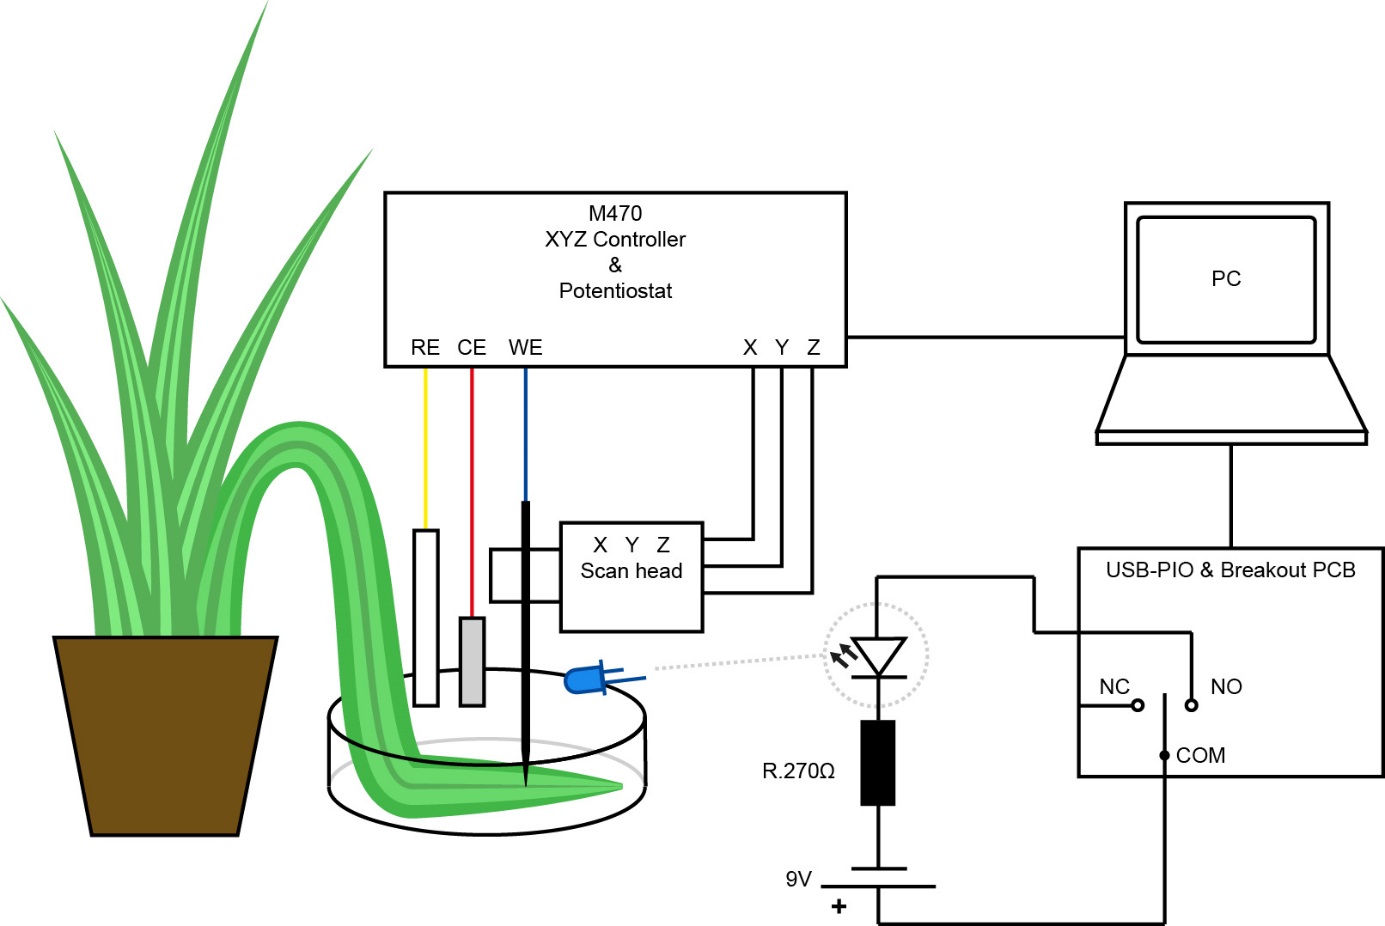
SECM measurements were performed in 0.1 x 10⁻³ mol L-1 KCl using a 10 µm diameter Pt UME probe. While the presence of K+ in the electrolyte can affect the closure of the stomata, the low concentrations used here mean light will still affect their activity [6]. A SCE reference electrode and a Pt sheet counter electrode were used. The redox reaction of interest was the reduction of O2 released by the plant stomata, therefore the Pt UME was biased at -0.75 V vs. SCE. The height of the probe during the measurement was determined by performing approach curves to the plant in ambient light. Before performing the measurements using the blue diode light an area scan was first performed in ambient light to determine the suitability of the area for measurement. For the measurements performed to determine the effect of the blue LED the scan head was placed under an opaque cover to ensure there was no ambient light contributing to the experiment.
Two different types of experiments were run using the USB-PIO. In both cases the USB-PIO was used to turn on and off a blue diode (λPeak: 465 nm) to illuminate the plant leaf. The LED was connected to the USB-PIO by output one NC and COM. By connecting the LED in this manner when the experiment writes to channel one the LED turns on, it then turns off when the experiment stops writing to channel one. If preferred the user can connect to the NO of output one instead of NC. In this case the LED will turn off when channel one is written to, and turn on whenever the experiment does not write to channel one. The same premise extends to all output channels. In the first experiment type a sequence was setup in which the USB-PIO turned the LED on for 10 minutes, and kept it on during an SECM area scan. After completing this scan the USB-PIO turned the LED off. There was then a 10 minute wait before running the next SECM area scan, with the LED still off. Both scans were performed in sweep scan mode over a 300 µm x 300 µm area. Data was collected at 3 µm intervals. In the second experiment type the USB-PIO was used as part of a six step modular map experiment, which was run after the plant had been in the dark for three hours. The steps of the sequence in the modular map experiment were:
- The USB-PIO turned on the LED.
- The probe was held at 0 V OCP for 3.000 s.
- The probe was biased at -0.75 V for 3.000 s. At 2.900 s data was collected and averaged over 0.001 s (data rate of 1000 Hz).
- The USB-PIO turned off the LED.
- The probe was held at 0 V OCP for 3.000 s.
- The probe was biased at -0.75 V for 3.000 s. At 2.900 s data was collected and averaged over 0.001 s (data rate of 1000 Hz).

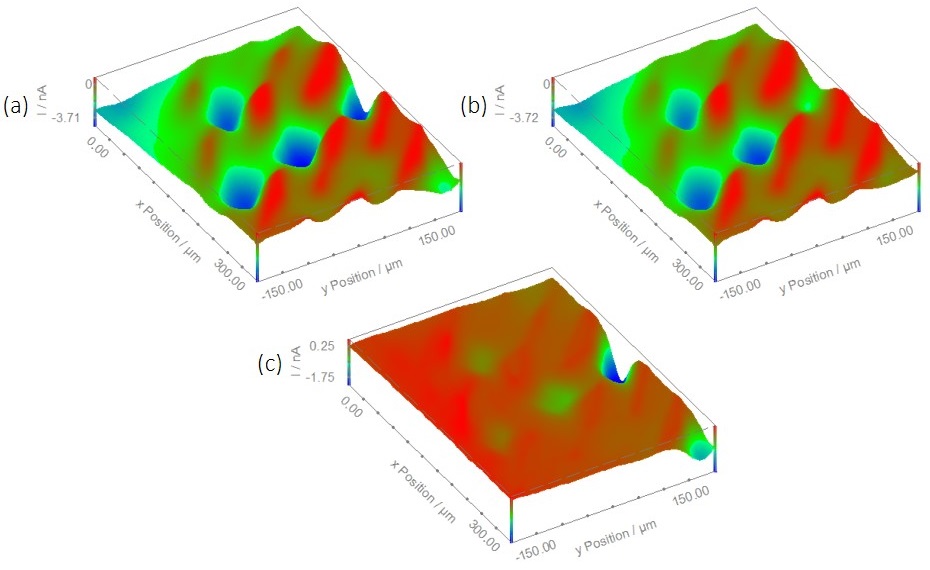
Figure 5: Area maps resulting from a sequence of SECM measurements with and without the LED on. (a) The blue LED was switched on for the duration of the area scan by the USB-PIO. (b) The blue LED was switched off for the duration of the area scan by the USB-PIO. (c) The result of subtracting map (b) from map (a).
After each sequence the probe moved to the next x-y point and then repeated the sequence. This was performed over a 300 µm x 300 µm area with 6 µm steps. The result of this was two complimentary area maps, one composed of the data collected during step 3 of each sequence of events, and one composed of the data collected during step 6 of each sequence of events.
Arithmetic on the final 2D plots was performed using either the M470 software, or Gwyddion [7]. 3DIsoPlot was used to convert the resulting 2D area maps into 3D maps.
Results
Using the USB-PIO in Sequence
The USB-PIO was initially used to determine the effect of having a blue LED on for the duration of an area scan experiment vs. having it off. The results can be seen in Fig 5. In this figure the areas of high current are due to increased O2 concentration from open stomata. The low current areas surrounding the stomata are due to the guard cells which, when turgid, are higher than the rest of the leaf. It can be seen that on going from the scan performed with the LED on to that performed with the LED off the current measured at the stomata decreases to varying degrees. This is particularly evident in the 3D map in Fig. 5c which is the map measured with the LED on minus the map measured with the LED off. Particularly noticeable is the change in the stomata at the top-middle of the map, which has an almost 50 % decrease in current. The decrease in current over the stomata on performing the measurement with the LED off is directly related to the decrease in O2 content as the stomata close in the dark. Fig. 5c also shows the current becoming positive over the guard cells surrounding the stomata, implying they are of lower current when the LED is on. This is indicative of an increase in topography due to the turgid guard cells when the LED is on.

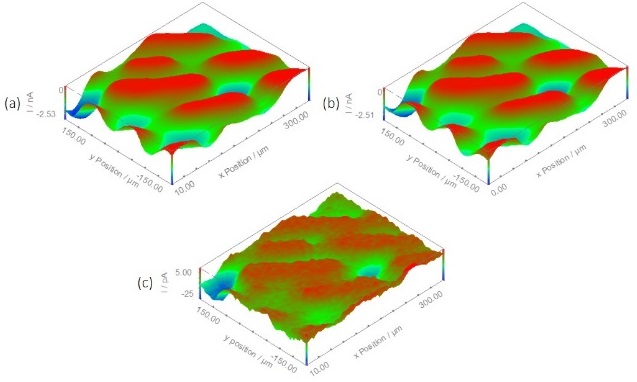
Figure 6: Area maps resulting from using the USB-PIO in a modular map experiment to turn a blue LED on and off. (a) Measured during step 3 of the modular map experiment with the LED on. (b) Measured during step 6 of the modular map experiment with the LED off. (c) The result of subtracting map (b) from map (a).
Using the USB-PIO in a Modular Map Experiment
The effect of switching a blue LED on and off on the O2 released by the spider plant was also investigated by using the USB-PIO in a modular map experiment. The area maps produced from this experiment are shown in Fig. 6. In their original state it is difficult to discern any difference in the measurement performed with the LED on, and that performed with the LED off. This is likely because after the plant stomata fully open it can take hours for them to close fully, though there is an initial sharp decline in their aperture [6], therefore large changes in the stomatal opening and closing are unlikely to occur on the timescale of the sequence of events at each x-y point. When the map measured with the LED off is subtracted from the map measured with the LED on, however, the effect of this change can fully be seen, Fig 6c. This figure shows that even over this short time frame the switching of a blue LED has an effect on the plant leaf.
Conclusion
The USB-PIO was used to switch a blue LED light on and off in order to investigate its effect on the stomatal opening and closing of a spider plant using SECM. It was seen that in both cases there is a distinct difference in the leaf stomata and guard cells when the LED is switched on and off. The effect of switching the LED off is more dramatic over the longer period afforded by the sequenced experiments than by the modular map experiment.
Acknowledgements
Ian Tindle is acknowledged for the graphical presentations of Figs. 1 and 4.
References
- Lee, J. Kwak, A. J. Bard, Proceedings of the National Academy of Science USA 87, 5 (1990) 1740-1743
- Tsionsky, Z. G. Cardon, A. J Bard, R. B. Jackson, Plant Physiology 113, 3 (1997) 895-901
- Mauzeroll, S. B. Schougaard, in : A. J. Bard, M. V. Mirkin (Ed.), Scanning Electrochemical Microscopy, 2nd Ed., CRC Press, Boca Raton (2012) 379.
- Zhu, S. M. Macfie, Z. Ding, Journal of Experimental Botany, 56, 421 (2005) 2831-2838
- Lawson, New Phytologist, 181, 1 (2009) 13-34
- D. Humble, T. C. Hsiao, Plant Physiology, 44, 2 (1969) 230-234
- Gwyddion data analysis software gwyddion.net


