ZSim and ZFit as learning tools. Part IV – The effect of high frequency inductance.
Latest updated: August 9, 2023This is the fourth in a series of articles about ZSim and ZFit as learning tools.
Summary:
- Part I – Acidic corrosion
- Part II – Why circle fitting is wrong?
- Part III – How to detect an inductive behaviour at low frequencies?
- Part IV – The effect of high frequency inductance
- Part V – How to choose the proper equivalent circuit?
- Part VI – Equivalent circuits distinguishability
- Part VII – Equivalent circuits identifiability
Sometimes high-frequency inductance is just removed, which is not good
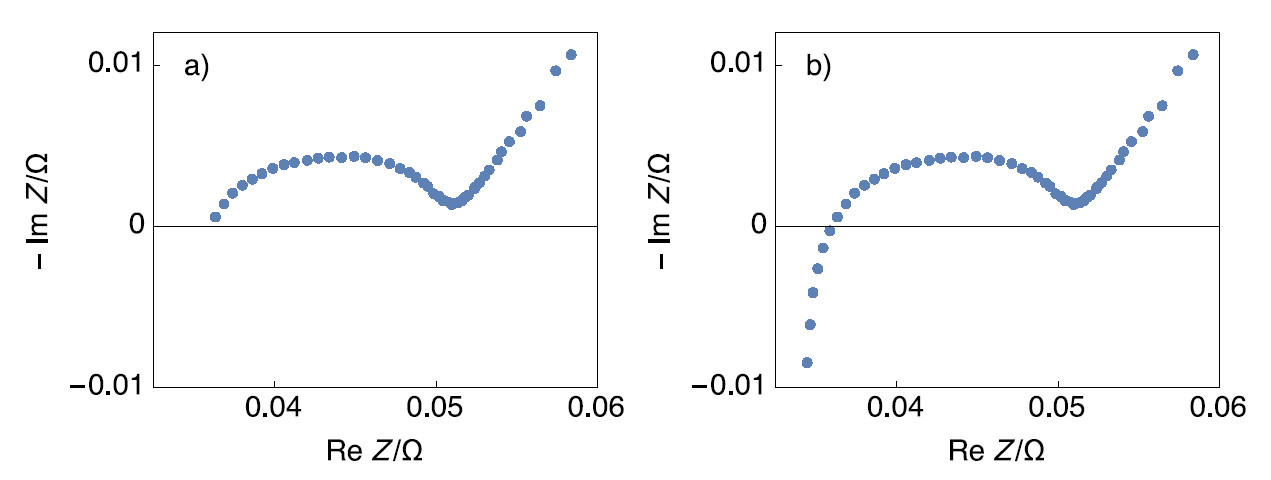
Sometimes in the literature, we can encounter battery impedance graphs that are plotted only in the capacitive half-plane as shown in Fig. 1a. However, most battery impedance graphs show a high-frequency inductive behavior as shown in Fig. 1b [1].

Figure 1: Nyquist impedance graph of a Li-ion battery a) plotted only in the capacitive half-plane; b) complete plot [1].
The influence of the value of the inductance L on the shape of the Nyquist impedance graph.
The analysis of the inductance influence on the measured electrochemical impedance was presented a long time ago [2]. The high-frequency depressed semi-circle shown in Fig. 1 can be simply modeled by the following circuit: L1 + R1 + C2/R2.
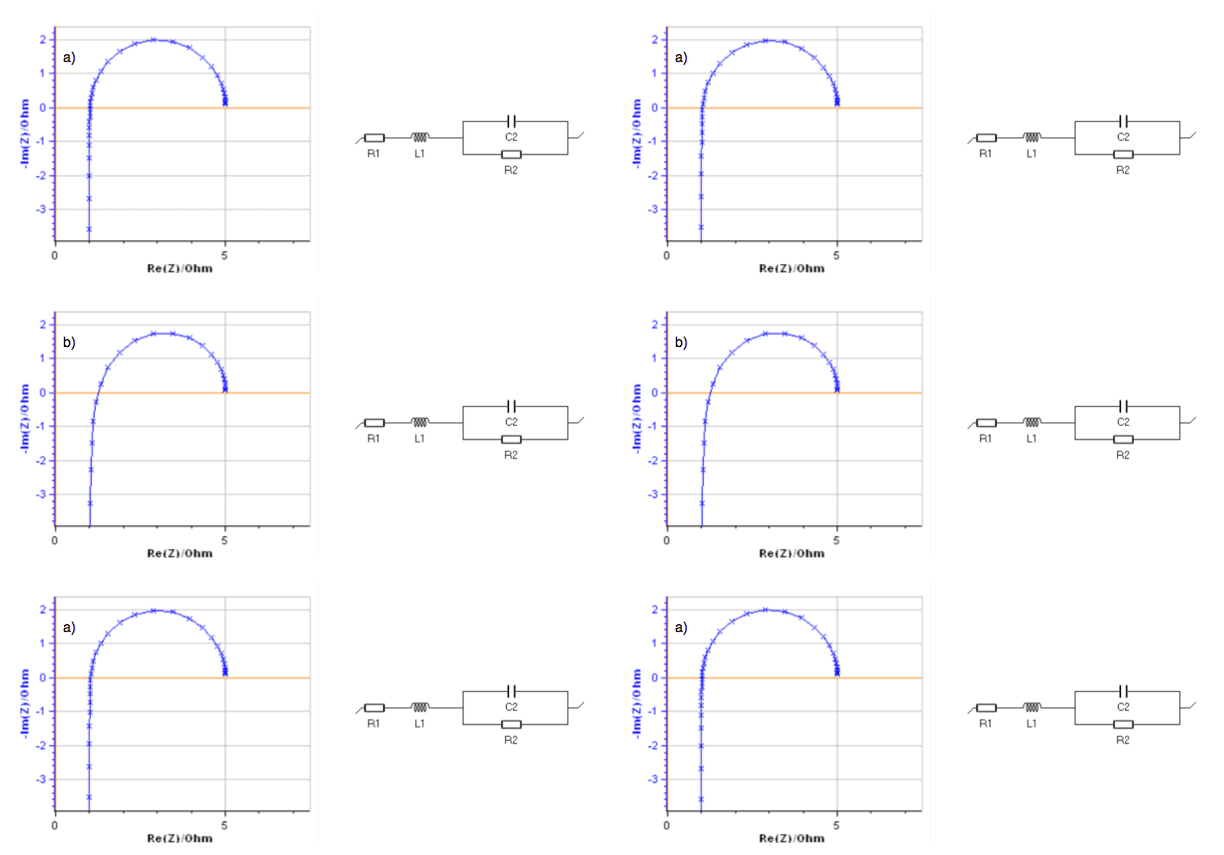
In the animation shown in Fig. 2, the evolution of the impedance graphs of the circuit defined above is shown for a certain range of values of the parameter L, the values of the other parameters being constant.

Figure 2: Impedance graphs of the circuit L1 + R1 + C2/R2 with R1 = 1 Ω, R2 = 4 Ω, C2 = 0.1 F
and L varying from a) 10-3 to 10-2 and b) 0.0316 to 0.1 H.
For a small inductance value (Fig. 2a), the impedance shows a semi-circle and a vertical line from low to high frequencies. It shows an accumulation of data points around Im Z = 0.
For a large inductance value (Fig. 2b), the arc is deformed and the data points move away from each other when the sign of Im Z is changing.
Partially fitting the data without accounting for high-frequency inductance leads to wrong values.
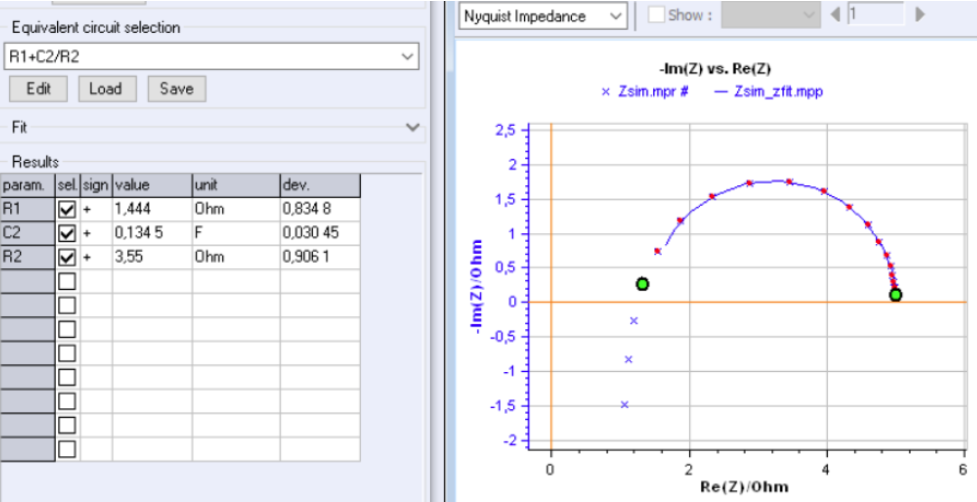
In Fig. 3, the impedance graph of the circuit L1 + R1 + C2/R2 with R1 = 1 Ω, R2 = 4 Ω, C2 = 0.1 F, L = 0.1 H was simulated with 8 points per frequency decade. This graph shows a deformed arc, which means a large inductance value.
If the inductance is neglected and the low-frequency arc is fitted with an R1 + C2/R2 circuit as it is shown in Fig. 3, all the calculated values are wrong: R1 and C2 are overestimated, R2 is underestimated.

Figure 3: Simulated impedance graph of the L1 + R1 + C2/R2 with R1 = 1 Ω, R2 = 4 Ω, C2 = 0.1 F, L = 0.1 H and
fitting of the low frequency arc with R1 + C2/R2. The calculated values are wrong.
Always fit impedance data completely and never fit partially.
When an impedance graph shows a high-frequency inductance, a good practice is to plot the graph completely and to avoid truncating the graph at high frequencies. Fitting the graph without including the high-frequency inductance can lead to erroneous values determination of the parameters of the chosen equivalent circuit.
References
[1] White paper #1. Studying batteries with Electrochemical Impedance Spectroscopy (EIS). 2018.
[2] B. Savova-Stoynov and Z. B. Stoynov J. Appl. Electrochem., 17 1987 1150 – 1158.
Also of interest...
Related products