

ZSim and ZFit as learning tools. Part III – How to detect an inductive behaviour at low frequencies
Latest updated: November 18, 2024This is the third in a series of articles about ZSim and ZFit as learning tools.
Summary:
- Part I – Acidic corrosion
- Part II – Why circle fitting is wrong?
- Part III – How to detect an inductive behaviour at low frequencies?
- Part IV – The effect of high frequency inductance
- Part V – How to choose the proper equivalent circuit?
- Part VI – Equivalent circuits distinguishability
- Part VII – Equivalent circuits identifiability
How to detect inductive behavior and why it is important
Impedance diagrams obtained on a metal corroding in an acidic media often present a low frequency inductive arc, as was shown in the corresponding topic (1). In this article, it will be shown how to detect such an inductive behaviour, even when it does not seem very apparent at first in the Nyquist representation.
Inductive arc condition for C1/R1/(R2+L2) circuit
Let us consider the C1/R1/(R2+L2) circuit shown in Fig. 1.
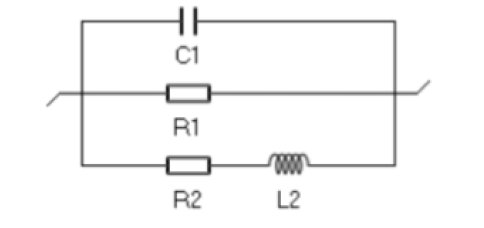
Figure1: C1/R1/(R2+L2) circuit.
Its impedance diagram in the Nyquist plane does not always have an inductive arc as shown by the change of the Nyquist diagram when $C1$ varies from $10^{-3}$~F to $10^{-2}$~F (Fig. 2).

Figure 2: C1/R1/(R2+L2) circuit: change of the Nyquist diagram when $C1$ varies from $10^{-3}$~F to $10^{-2}$~F.
The inductive character is reflected in the Bode plane by a modulus that shows a peak, even when the sign of the phase does not change and the Nyquist graph no longer contains an inductive arc as it is shown in Fig.3.
Plotting the impedance modulus in the Bode representation, therefore, allows a better detection of the presence of an inductance at low frequencies in an equivalent circuit.

Figure 3: C1/R1/(R2+L2) circuit: change of modulus and phase plots of the impedance
when $C1$ varies from $10^{-3}$~F to $10^{-2}$~F.
Moreover, it is easy to check in the Nyquist plane, using ZSim, that the impedance diagram of the C1/R1/(R2+L2) circuit shows a low frequency inductive arc when $C1 < L2/R2^2$.
Bode and Nyquist plots are complementary
The Nyquist and Bode plots of impedance are complementary: in this case, the presence of a low-frequency inductance not detectable in the Nyquist representation can be detected in the Bode plot.
[1] Topic “Z Sim and Z Fit as learning tools. I Acidic Corrosion”


