

ZSim and ZFit as learning tools. Part II – Why circle fitting is wrong?
Latest updated: November 18, 2024This article is the second in a series about ZSim and ZFit as learning tools.
Summary:
- Part I – Acidic corrosion
- Part II – Why circle fitting is wrong?
- Part III – How to detect an inductive behaviour at low frequencies?
- Part IV – The effect of high frequency inductance
- Part V – How to choose the proper equivalent circuit?
- Part VI – Equivalent circuits distinguishability
- Part VII – Equivalent circuits identifiability
Circle or partial fitting is often a mistake. Why?
In the literature, we often find impedance graphs that look like the one shown in Fig. 1. Using ZSim and ZFit, it is easy to show the interpretation mistake that is contained within such a representation.

Figure 1: Compass or circle fitting of an impedance graph made of two R/C circuits with two slightly decoupled arcs.
Circle or partial fitting is often a mistake
Using the ZSim (part of EC-Lab®) impedance simulation tool, it is quite easy to plot and simulate an impedance graph close to the one shown in Fig. 1 (Fig. 2). The ratio between the time constants $\tau_1 = R1C1 = 3 \times 10^{-5}\ \mathrm{s}$ and $\tau_2 = R2C2 = 7 \times 10^{-4}\ \mathrm{s}$, equal to ${\tau_2}/{\tau_1}=23.33\ \mathrm{s}$ is not sufficient to ensure two clearly separated or decoupled impedance arcs.
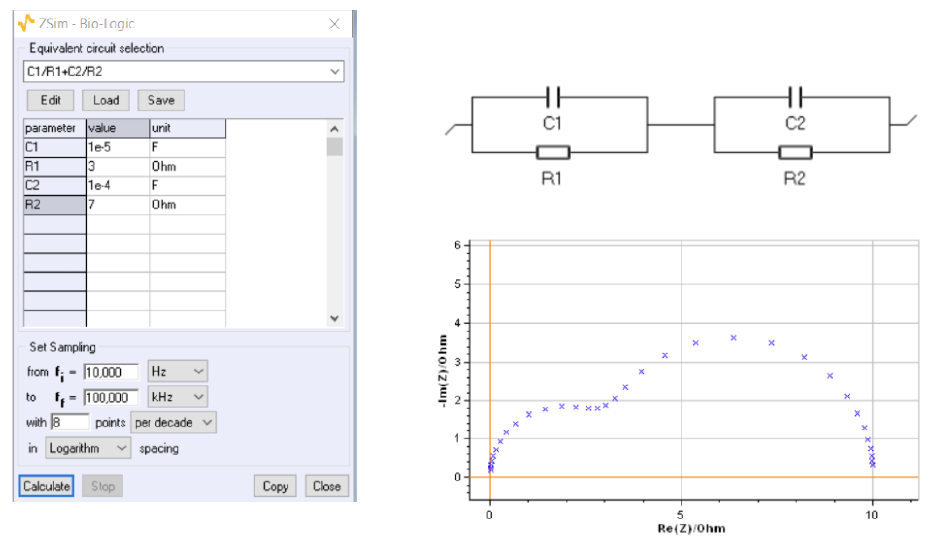
Figure 2: Impedance graph of the C1/R1 + C2/R2 circuit with $R1 \ = \ 3 \ \Omega$, $C1 \ = \ 10^{-5} \ \mathrm{F}$, $R2 \ = \ 7 \ \Omega$, $C2 \ = \ 10^{-4} \ \mathrm{F}$.
Circle fitting the high-frequency arc gives wrong values
Using ZFit, the impedance data fitting tool available in EC-Lab®, it is possible to only fit the first arc at high frequencies (HF), using the cursors that we can see on the graph (Fig. 3). Fitting only the first arc is the same as using a circle fit or a compass to fit the data. The results that are found with this method are partly wrong: the capacitance value is close to the expected one, the value of $R1$ is $R1_{\mathrm{HF}} \ = \ 3.677 \ \Omega$, which is quite far from the expected value.

Figure 3: Fitting of the high frequency arc of the impedance graph shown in Fig. 2.
Circle fitting the high-frequency arc gives wrong values
Fitting the low-frequency arc using an R1+C2/R2 circuit, which, again, is equivalent to using a compass or the circle fit tool, leads to the results shown in Fig. 4. These results are quite different from the expected ones shown in Fig. 2.

Figure 4: Fitting of the low-frequency arc of the impedance graph shown in Fig. 2.
When you have two slightly decoupled semi-circles, always fit both semi-circles
Partially fitting the impedance graph shown in Fig. 2, using a compass or a circle fit tool, and not the complete graph leads to inconsistent results as can be seen in Fig. 5. Indeed, we find two erroneous values for R1 and R2 resistances with $R1_{\mathrm{HF}} \ + \ R2_{\mathrm{BF}} \ = \ 3.677 \ + \ 7.275 \ = \ 10.952 \ \Omega \ \neq \ 10 \ \Omega$.
Furthermore, the capacitance values are also slightly wrong: $C1_\mathrm{HF} \ = \ 9.814 \ \times \ 10^{-6} \ \mathrm{F} \ \neq \ C1 \ = \ 10^{-5} \ \mathrm{F}$ and $C2_\mathrm{BF} \ = \ 91.95 \ \times \ 10^{-6} \ \mathrm{F} \ \neq \ C2 \ = \ 10^{-4} \ \mathrm{F}$.
In the case of similar time constants, partially fitting two arcs, as it is done when using the circle fit tool or a compass can lead to wrong results.

Figure 5: Impedance graph of the circuit C1/R1 + C2/R2 shown in Fig. 2 (blue cross and line) and impedance graphs
of the circuit C1/R1 (green line) and the circuit R1 + C2/R2 (red line) calculated using the results of the partial fits shown in Figs. 3 and 4, respectively.
More on this subject...


