

Electrochemical characterisation of fuel cells and electrolysers
Latest updated: November 19, 2024Introduction
Fuel cells (FCs) are similar to batteries, but their capacity is not related to the size of the system but to the amount of provided fuel. In an FC, as in a discharging battery, the reaction that takes place on the positive side is a reduction, and the positive electrode is a cathode and the reaction that takes place on the negative side is an oxidation and the negative electrode is an anode.
Electrolysers are like batteries under charge. In an electrolyser, as in a recharging battery, the reaction that takes place on the positive side is an oxidation, the positive electrode is an anode, and the reaction that takes place at the negative side is a reduction, and the negative electrode is then a cathode.
Fuel cells
FCs are batteries in which the electrodes are the site of electrochemical reactions where the reactants, usually gases, are fed continuously as they are consumed. FCs are open systems and can work in steady-state conditions, which is not the case of batteries (except metal-air batteries), which are closed systems with electrodes behaving as blocking electrodes in steady-state conditions, meaning a zero current and that the only steady-state condition of batteries is equilibrium.
Depending on the reactants, several types of FCs exist:
- FC with hydrogen, oxygen or air (PEMFC, SOFC)
The principles are schematically shown in Fig. 1 and the reactions are described in Eqs. 2 and 3 of the introductory article on fuel cells and electrolysers for a polymer electrolyte membrane FC (PEMFC), where protons are carried through the membrane to react with air or oxygen. In solid oxide fuel cells (SOFC), reduced oxygen is carried through the membrane and reacts with hydrogen. SOFCs use ceramics, which are electronically and ionically conductive only at very high temperatures (ca 600 – 1200 °C) [1].
- Direct Methanol Fuel Cell (DMFC) [2]
DMFCs are a subcategory of PEMFC, where the fuel is not hydrogen but methanol, less dangerous than hydrogen and also with a higher energy density. The methanol uses water and oxidizes to form proton and carbon dioxide:
$$\text {CH}_3 \text {OH} + \text H_2 \text O \rightarrow 6 \text H^+ + 6 \text e^- + \text {CO}_2\tag{1}$$
The anodic reaction is the same as for a PEMFC.
- Redox Flow Batteries (RFBs)
RFBs use as reactants electrolytes that contain species with higher oxidation number on the cathodic side (catholyte) and lower oxidation number on the anodic side (anolyte). The most common RFBs uses vanadium as redox species thanks to the numerous and stable oxidation states that this species can take. More information about the characterization of RFBs using BioLogic equipment can be found in BioLogic Application Note 71.
Polarisation curves
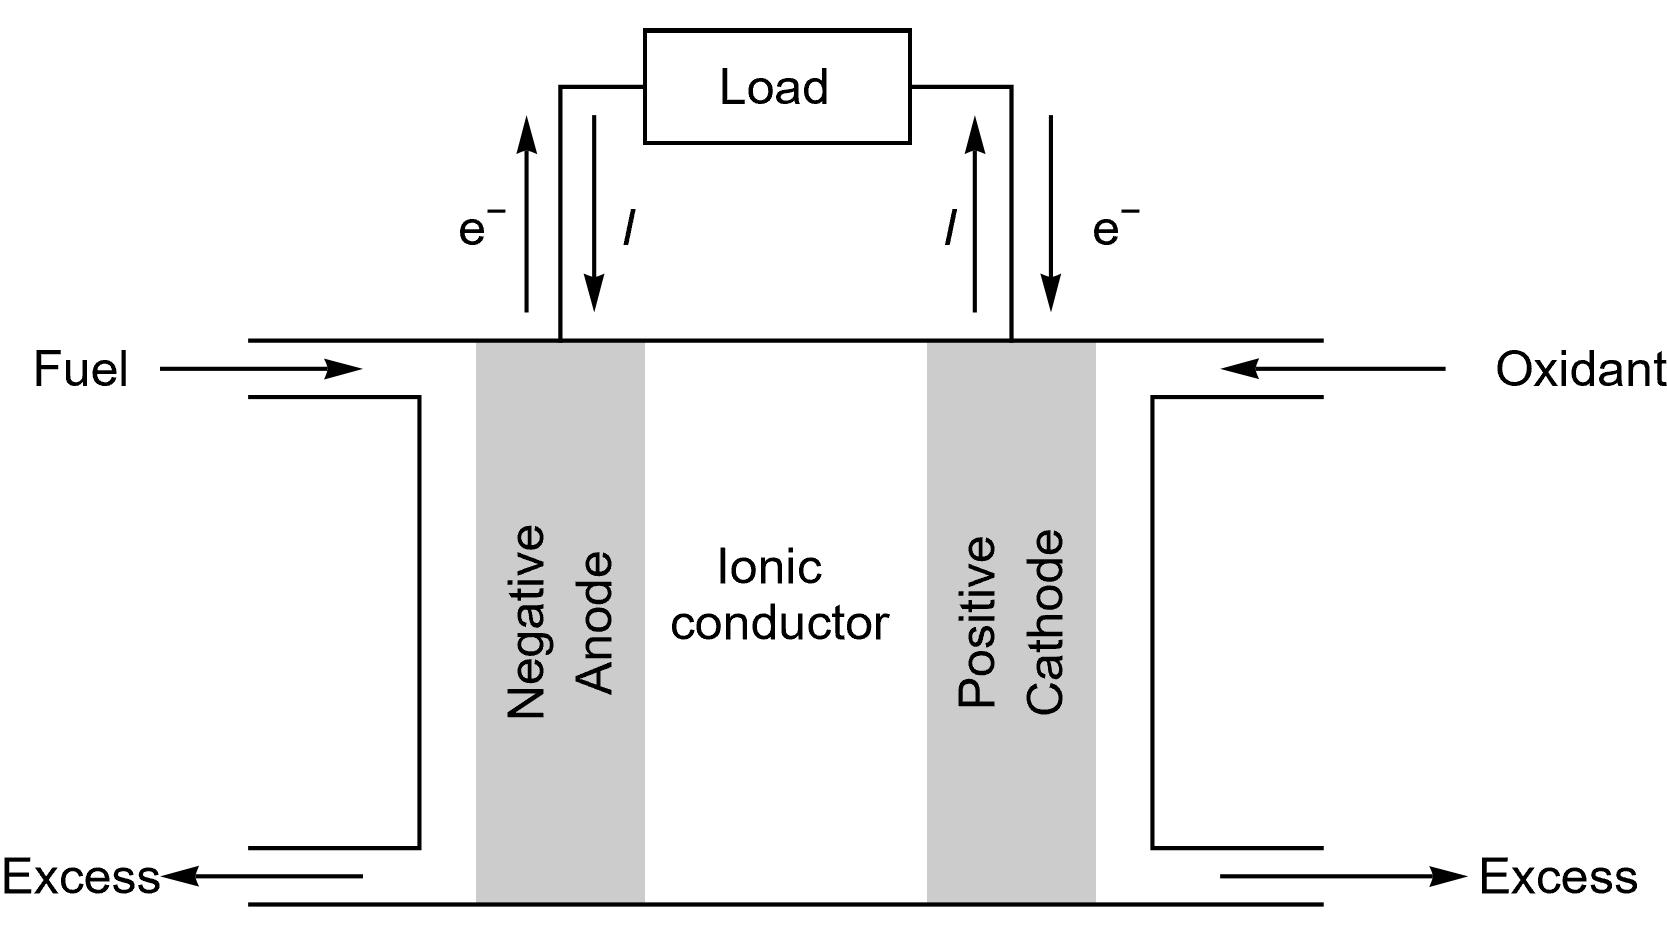
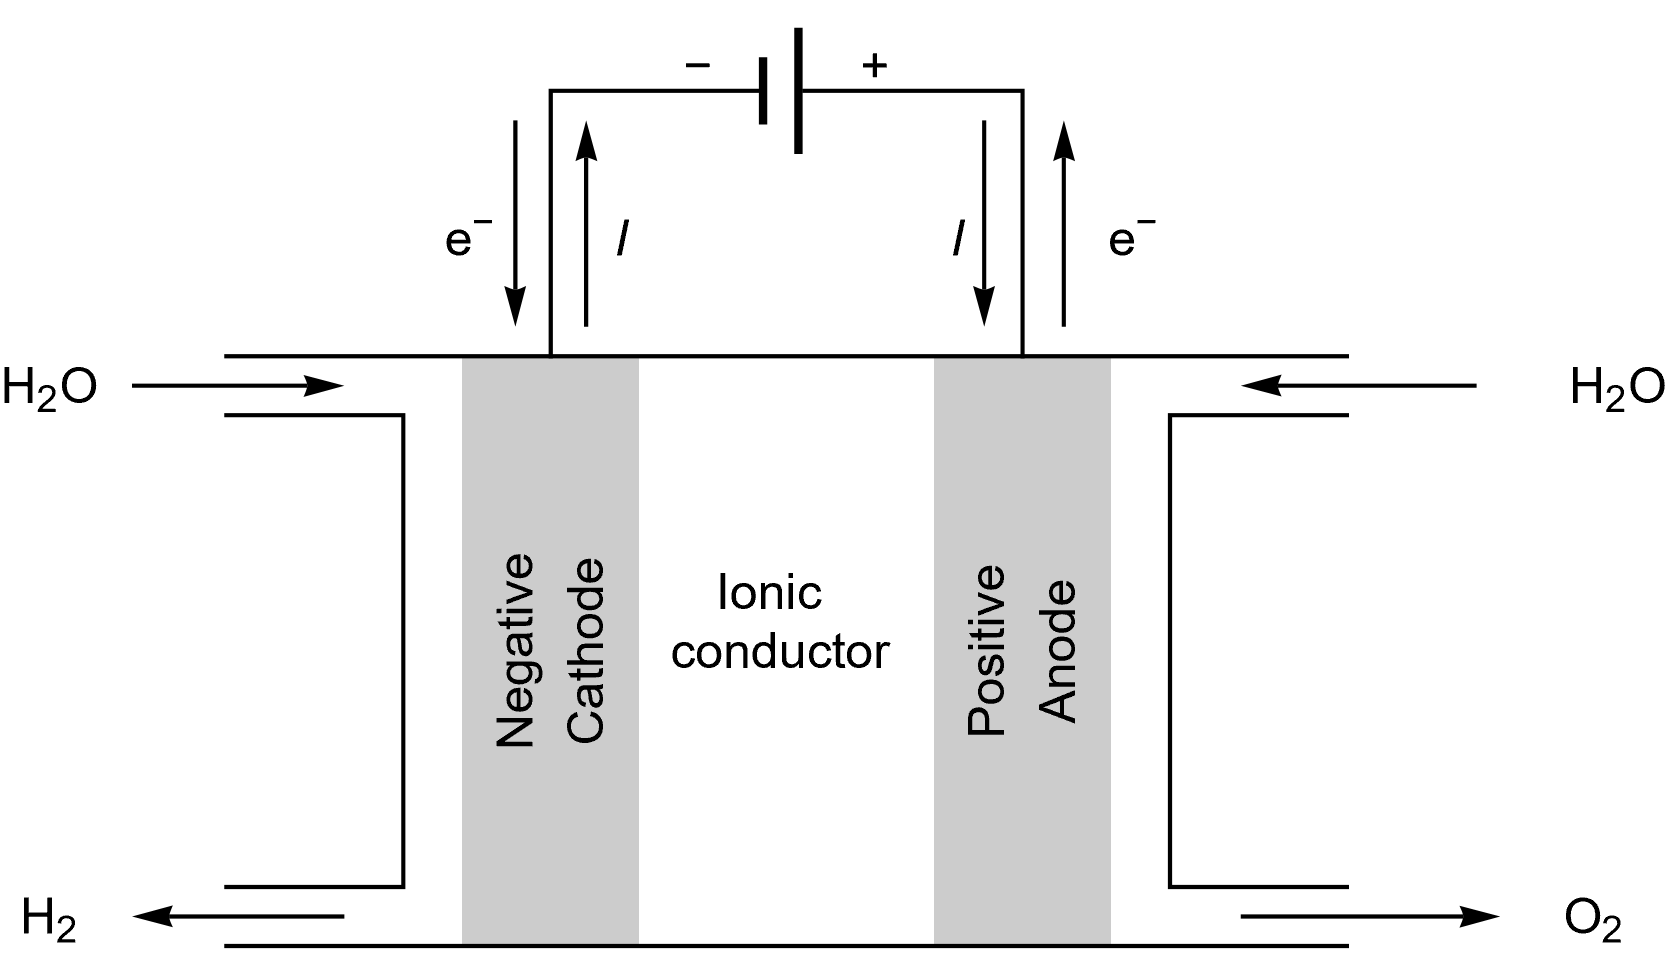
The same terminology as for a battery cell can be used for FCs, as it can be seen in Figure 1. Again, “A fuel cell resembles a battery in many respects, but it can supply electrical energy over a much longer period of time. This is because a fuel cell is continuously supplied with fuel and air (or oxygen) from an external source, whereas a battery contains only a limited amount of fuel material and oxidant that are depleted with use.” [3]

Figure 1: Schematics describing a generic fuel cell under operation.
Assuming Butler-Volmer kinetics
A fuel cell is an electrochemical system and as such the most basic way to describe the kinetics of the reactions is to consider that the reactions at the electrodes (Hydrogen Evolution Reaction or HER at the cathode and Oxygen Evolution Reaction or OER at the anode) of the FCs follow Butler-Volmer relationships, which means their rates are controlled only by electron transfer.
Assuming equal symmetry factors of 1/2, a number of electrons equal to 1 for both electrodes and $f_\text N = f/(RT)$, the general expressions of the evolution of current with potential write:
$$I_\text p=I_\text{0,p}(\text {exp}(f_\text N(E_\text p-E_\text {th,p})/2)- \text {exp}(-f_\text N(E_\text p-E_\text {th,p})/2))\tag{2}$$
at the cathodic, or positive side and:
$$I_\text n=I_\text{0,n}(\text {exp}(f_\text N(E_\text n-E_\text {th,n})/2)- \text {exp}(-f_\text N(E_\text n-E_\text {th,n})/2))\tag{3}$$
at the anodic, or negative side, where $I_\text 0$ denotes the exchange current densities of the reactions, $E_\text {th}$ their thermodynamic equilibrium potential, $E_\text p$ and $E_\text n$, the potential at the positive and negative electrode, respectively.
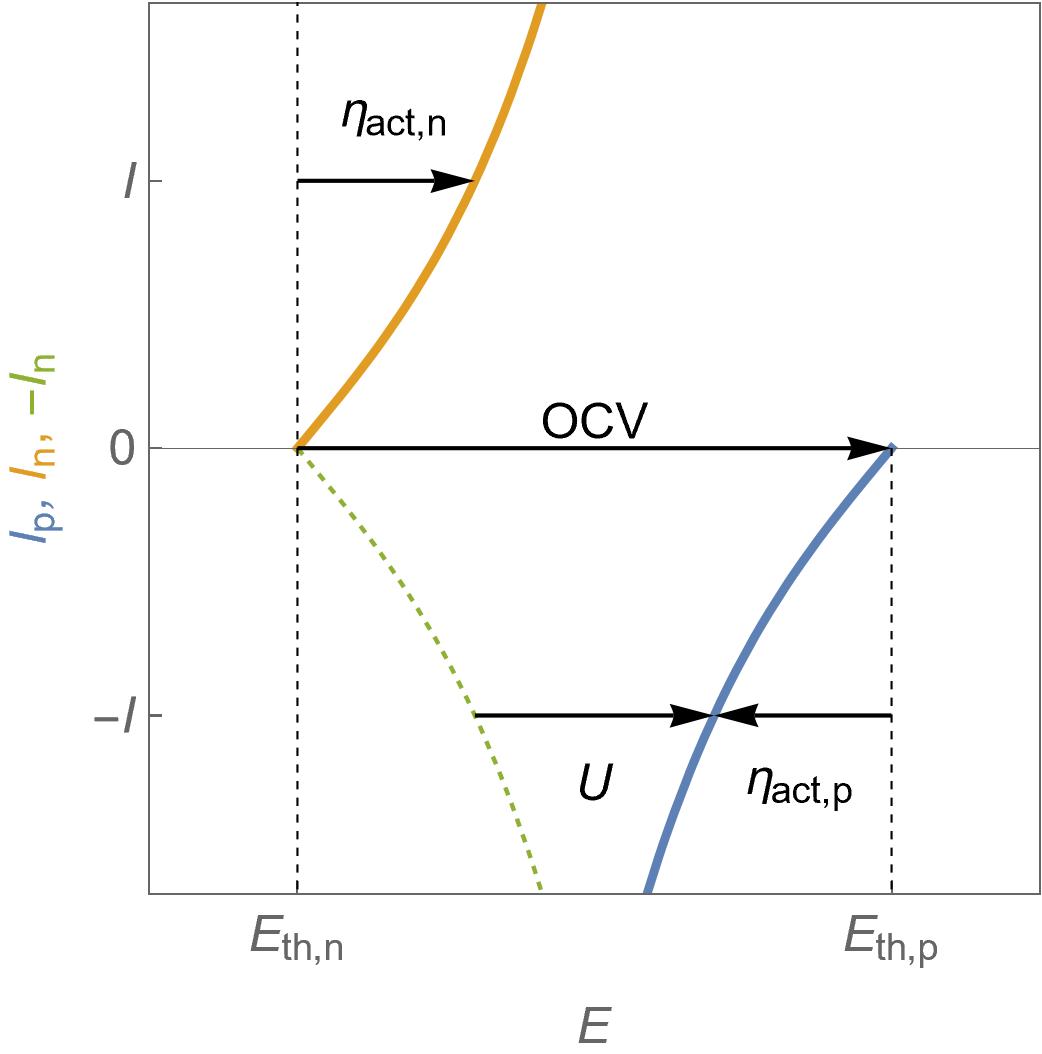
Eqs. 2 and 3 are plotted in Fig. 2 in the operating conditions of a fuel cell that is to say $U=E_\text p-E_\text n\lt \text {OCV}=E_\text {th,p} – E_\text {th,n}$, where $\text {OCV}$ stands for Open Circuit Voltage, which is equivalent to $\text {emf}$ the electromotive force.
For each electrode, the activation overvoltage is also shown, which is defined by $\eta_\text{act,p}= E_\text p – E_\text {th,p} $ for the positive electrode and $\eta_\text{act,n}= E_\text n – E_\text {th,n}$ for the negative electrode.
In the case of an operating fuel cell, $\eta_\text{act,p}<0$ and $\eta_\text{act,n}>0$
The full fuel cell activation overvoltage $\eta_\text {act}=\eta_\text{act,p}-\eta_\text{act,n}=U-\text {OCV}$ is also negative.
In Fig. 2, the dashed green curve is the symmetrical curve of $I_\text p$ around the $I=0$ axis and is used to conveniently represent that the cell at a voltage $U$ delivers a current $-I$.

Figure 2: $I\; vs. E$ characteristics for the positive and the negative electrodes of a fuel cell following Butler-Volmer kinetics. One can also see the activation overvoltages, the cell voltage $U$ and the Open Circuit Voltage $\text {OCV}$.
Instead of expressing $I\; vs. E$, we can express $E\; vs. I$:
- at the positive electrode, the cathode in our case, the potential $E_\text p$ is:
$$E_\text p= E_\text {th,p}-\frac{2}{f_\text N}\text {ln}\left(\frac{\sqrt{I^2+4I^2_\text{0,p}}+I}{2I_\text{0,p}}\right)\tag{4}$$
and at the negative electrode, the anode in our case $E_\text n$ is:
$$E_\text n= E_\text {th,n}-\frac{2}{f_\text N}\text {ln}\left(\frac{\sqrt{I^2+4I^2_\text{0,n}}-I}{2I_\text{0,n}}\right)\tag{5}$$
The FC voltage $U= E_\text p- E_\text n$ then writes:
$$U=(E_\text{th,p}-E_\text{th,n})+\frac{2}{f_\text N} \left(\ln \left(\frac{\sqrt{4I_\text {0,n}^2+I^2}-I}{I_\text{0,n}}\right)-\ln \left(\frac{\sqrt{4I_\text {0,p}^2+I^2}-I}{I_\text{0,p}}\right)\right)\tag{6}$$
Figure 3 shows the evolution of the potential at the positive and negative electrodes with $I$ under Butler-Volmer kinetics assumption. The fuel cell voltage $U$ is also represented as well as the activation overvoltages at the positive and negative electrodes and the $\text {OCV}$.

Figure 3: $E\;vs. -I$ characteristic of the positive and the negative potentials as a function of the cell current for a fuel cell following Butler-Volmer kinetics. The cell voltage $U$ is also shown as well as the activation overvoltages at the positive and negative electrodes and the $\text {OCV}$.
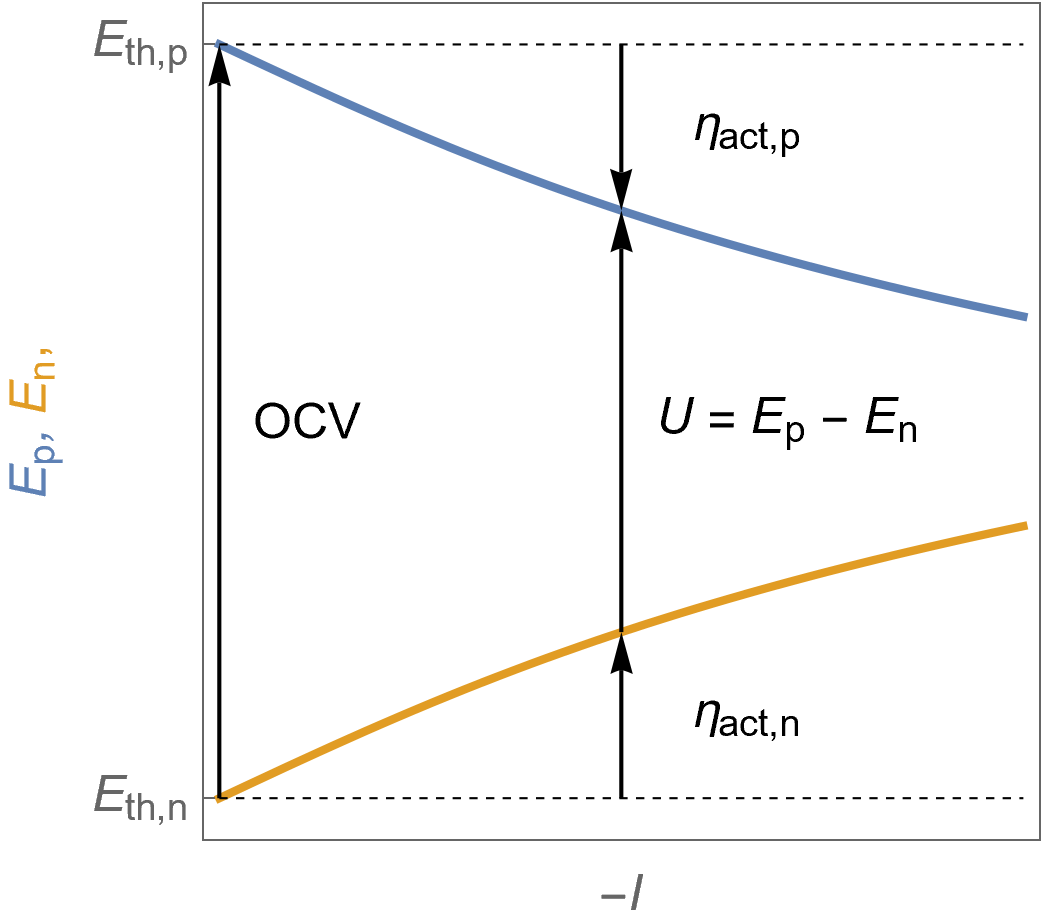
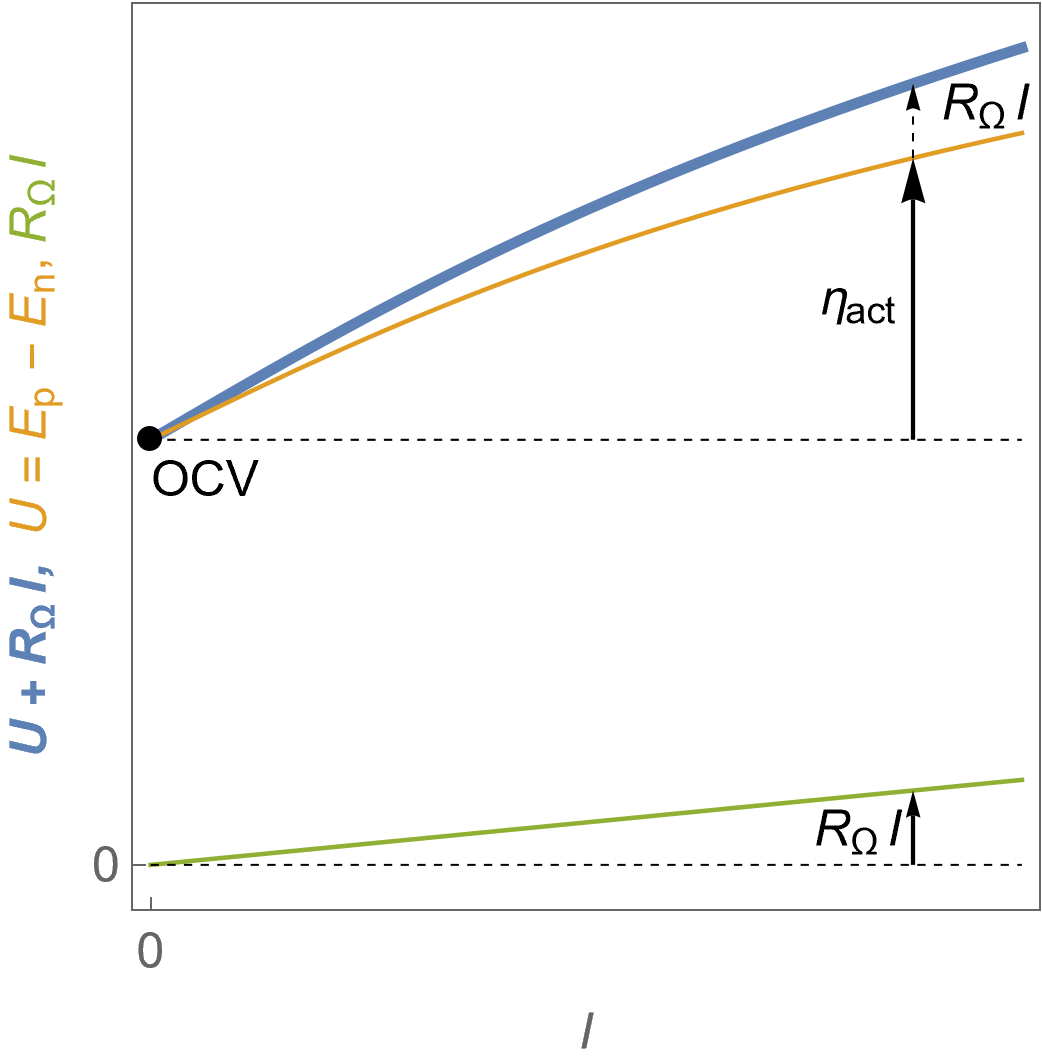
Figure 4 shows the evolution of the FC voltage as a function of the current along with the contribution of the ohmic drop. Details on the origin of the ohmic drop and the tools in EC-Lab® to compensate it can be found in the BioLogic Learning Center article introducing the ohmic drop correction.
It can be seen in Fig. 4 that the ohmic drop $R_\Omega I$ increases in absolute value linearly with the current. The ohmic resistance $R_\Omega$ can originate from various components of the FC: current collectors, electrical contacts, ionic conductors…
The blue curve represents the evolution of the voltage on a cell where ohmic drop is equal to $R_\Omega I$. The orange curve represents the theoretical voltage $U$, that is to say if the measured voltage was corrected from ohmic drop. The green curve represents the ohmic drop.

Figure 4: $U\;vs. -I$ characteristics for a fuel cell following Butler-Volmer kinetics in the presence of an ohmic drop, the theoretical voltage $U$ and the ohmic drop $R_\Omega I$.
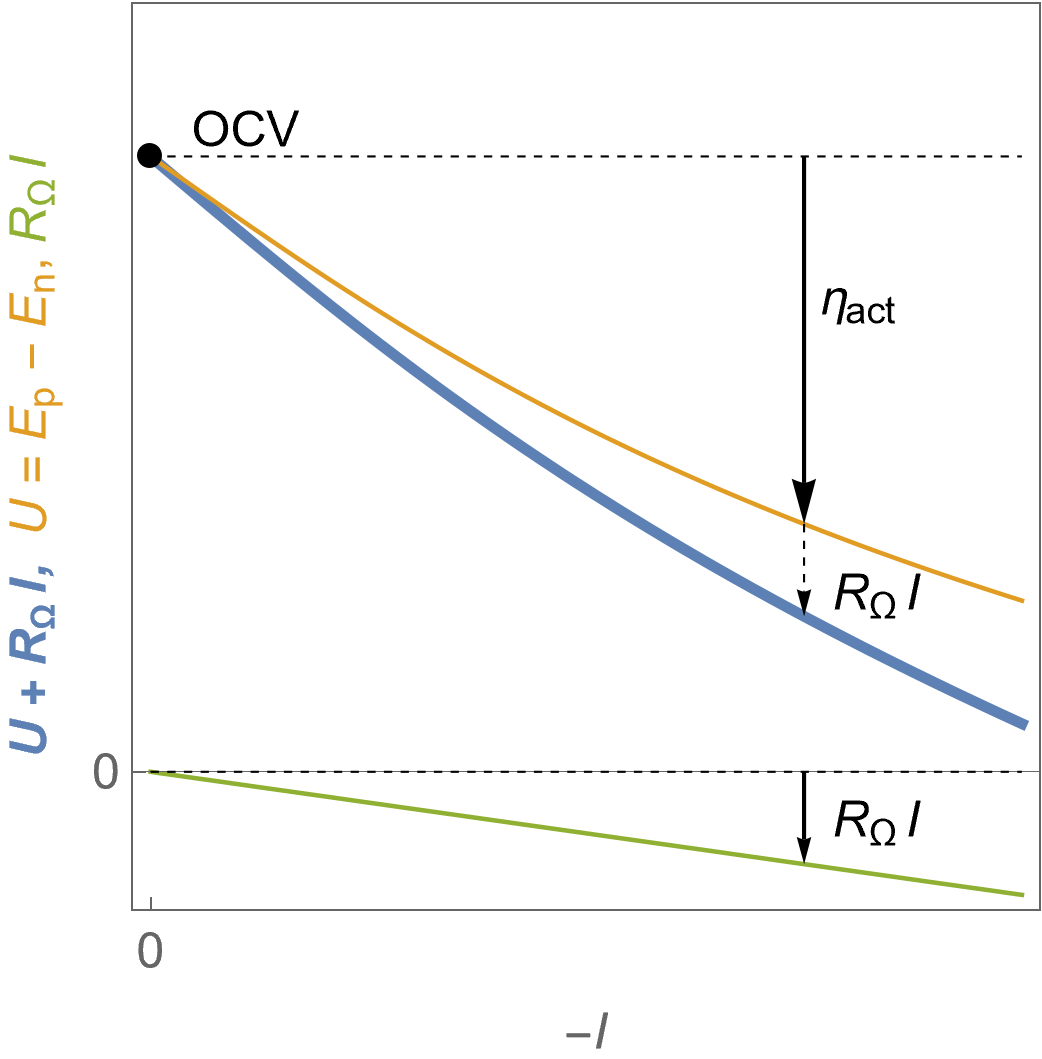
As it can be seen from Figure 4, reducing ohmic drop and overvoltages allows to use less energy (voltage) to draw more power (current) from the fuel cell.
Assuming Butler-Volmer kinetics with interfacial depletion of electroactive species
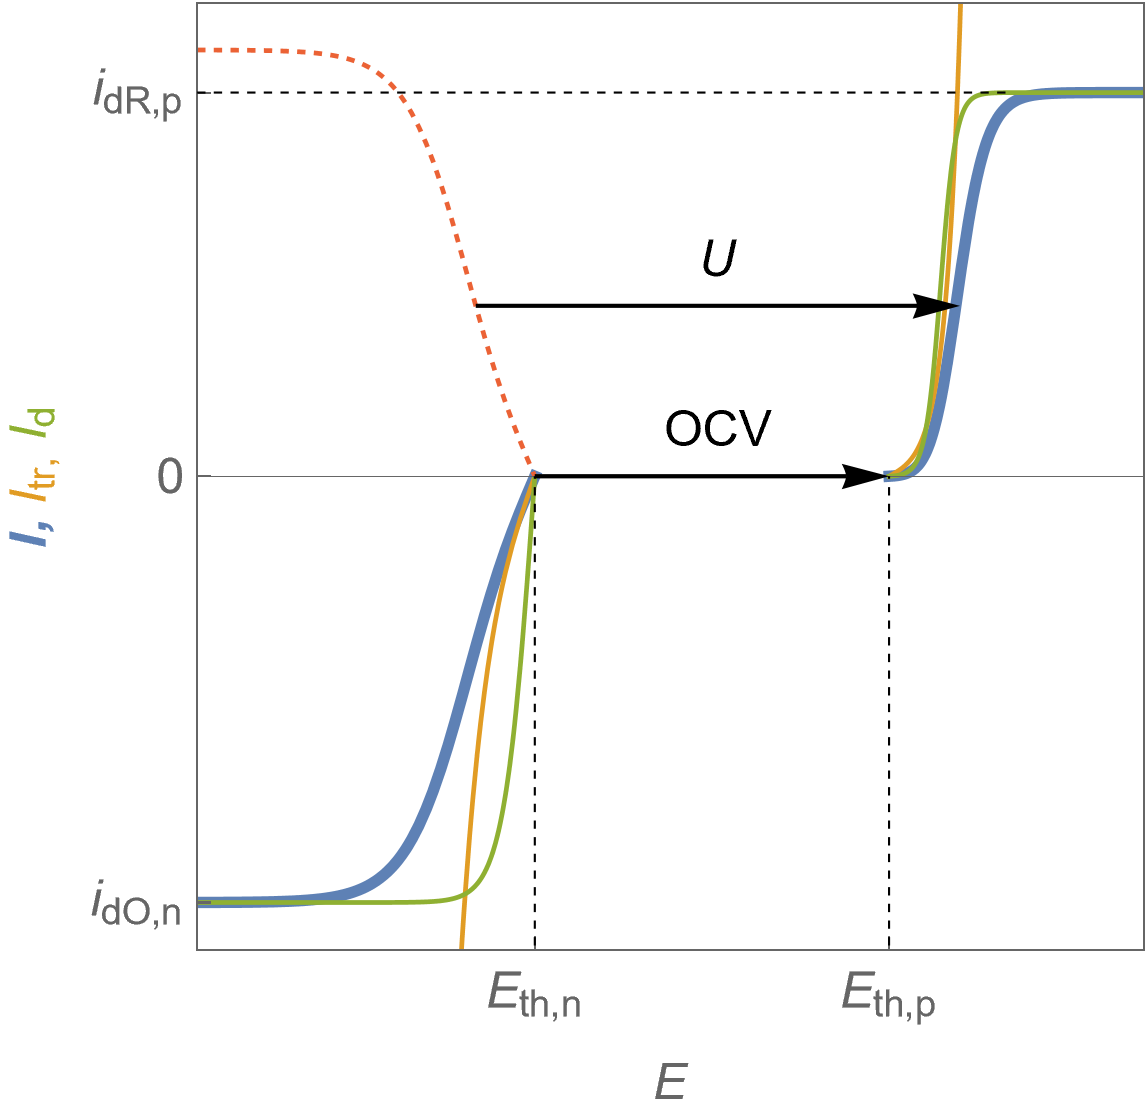
It is now assumed that the steady-state $I\; vs. E$ characteristics of each electrode show limitation by mass transport, as can be seen in Fig. 5.
Figure 5 shows the total Faradaic current $I$ in blue, the charge or electronic transfer current $I_\text {tr}$ in orange, which could be also named “Butler-Volmer” current and the mass-transport current $I_\text d$.
The expression of the Faradaic current $I$ can be found in [4, p. 104] and it must be noted that
$$\frac{1}{I}=\frac{1}{ I_\text {tr}}+\frac{1}{ I_\text {d}}\tag{7}$$
where $I_\text {tr}$ is the charge transfer current and $I_\text d$ the diffusion current or the total current for an infinite value of the exchange current $I_0$ in Eq. 2 and 3.
The reduction current value at the positive electrode is limited by the depletion of the oxidizing species $\text O$ so it is symbolized by $I_\text{dO,p}$. Similarly, the oxidation limit current value at the negative electrode is symbolized by $I_\text{dR,n}$.

Figure 5: $I\; vs. E$ characteristics of the positive and the negative electrodes for a fuel cell following Butler-Volmer kinetics with mass transport limitation. Blue curves: total Faradaic current, orange curves: electronic transfer current, green curves: diffusion current.
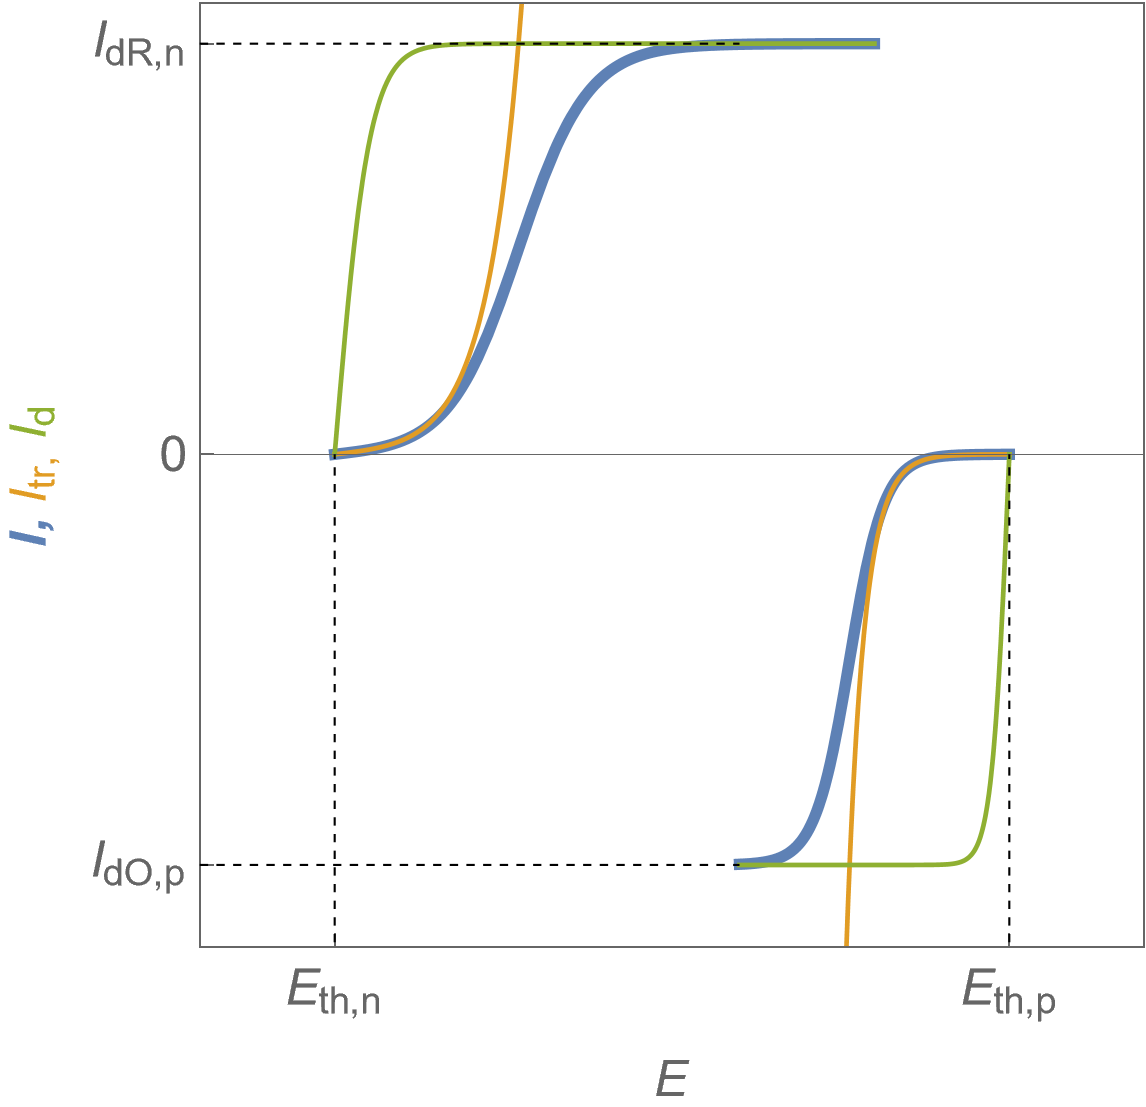
Figure 6 shows the evolution of the potentials at the positive and the negative electrodes. The voltage drop at the end is only due to mass transfer limitations. The blue curves show the electrode potentials $E$, orange curves show the “Butler-Volmer only” behaviour of both electrodes, or charge transfer potentials $E_\text {tr}$ and the green curves $E-E_\text {tr}$.
We can also define an additional overvoltage at each electrode $\eta_\text{dif}$: at the positive electrode, $\eta_\text{dif,p}=E_\text p-E_\text{tr,p}- E_\text{th,p}=E_\text p-\eta_\text {act,p}$ and at the negative electrode $\eta_\text{dif,n}=E_\text n-E_\text{tr,n}- E_\text{th,n}= E_\text n-\eta_\text {act,n}$.
Please note that $E-E_\text {tr}$ is not the diffusion potential, that is to say the potential values corresponding to the diffusion current in Fig. 5.
Figure 6: $E\; vs. -I$ characteristics of the positive (top curves) and the negative (bottom curves) potentials as a function of the cell current for a fuel cell following Butler-Volmer kinetics with mass transport limitation. The cell voltage $U$ is also shown. Blue curves: electrodes potential $E$, orange curves: charge transfer potential $E_\text {tr}$, as well as the corresponding overvoltages defined in the text.
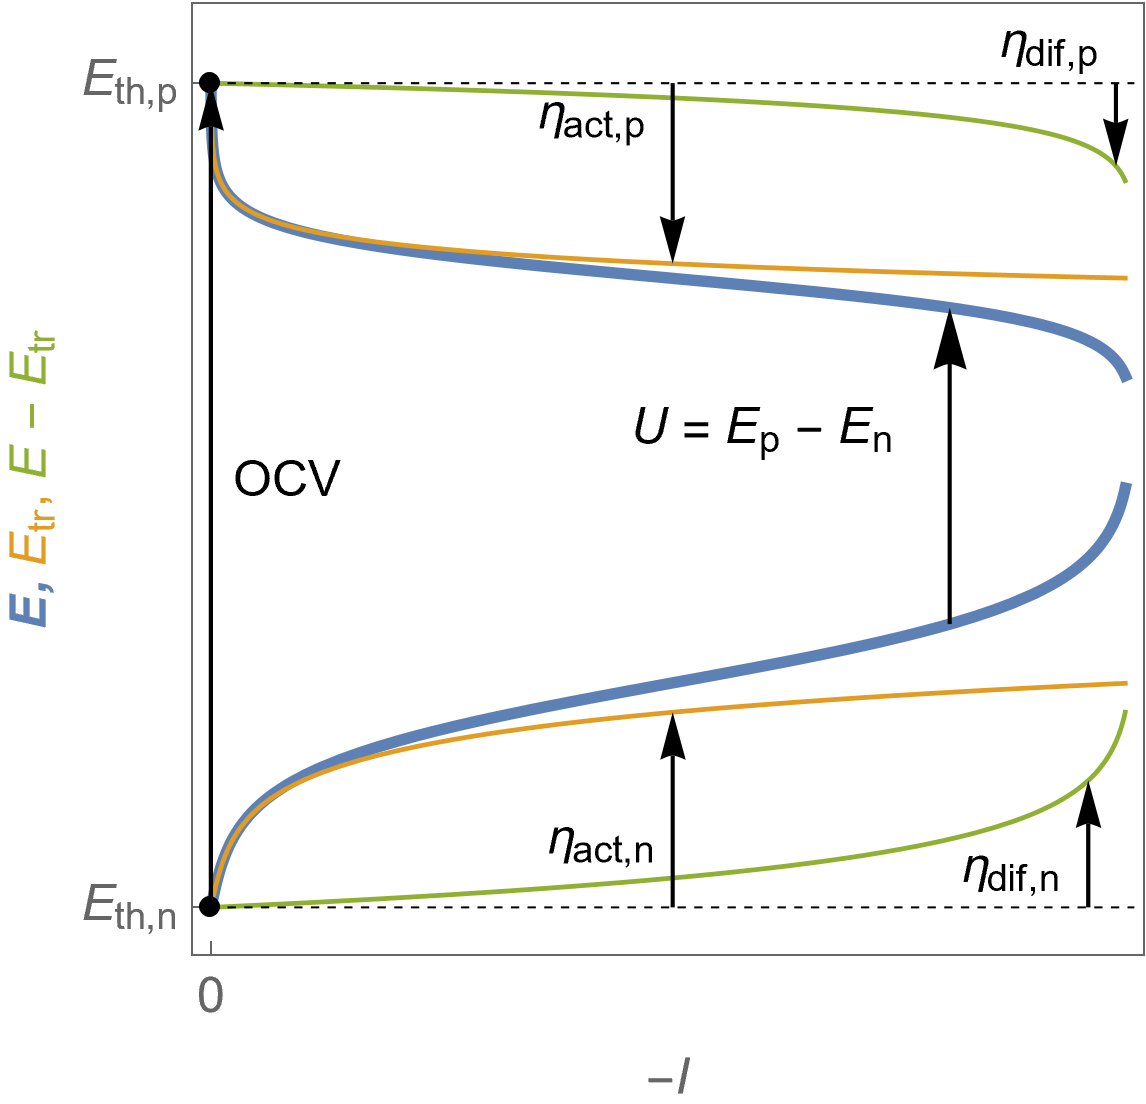
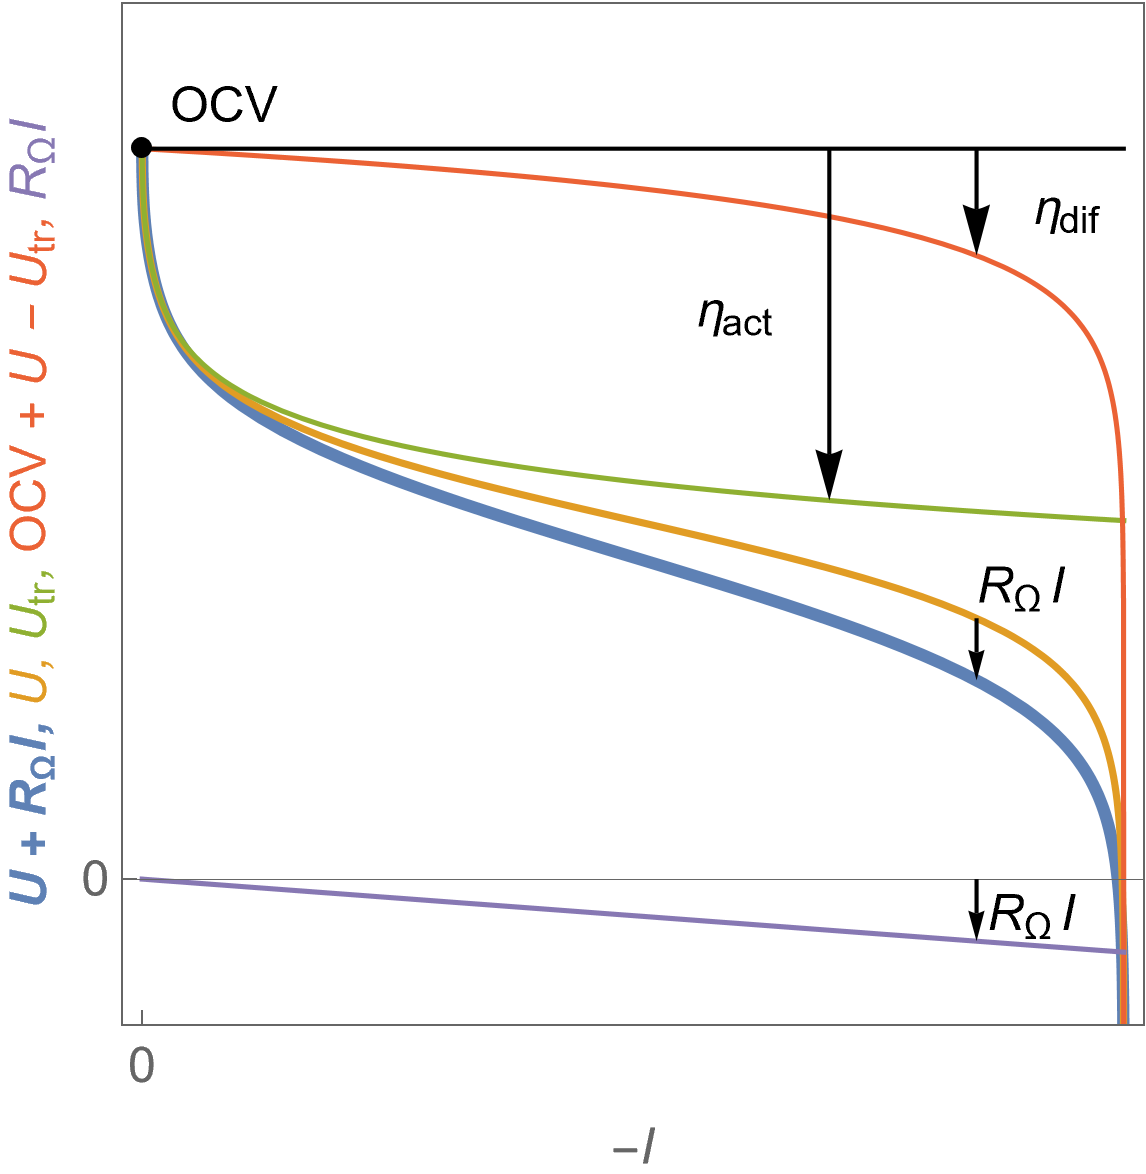
Figure 7 shows the evolution of the cell voltage $U$ with current for a fuel cell following Butler-Volmer kinetics with mass transport limitation and in the presence of ohmic drop $R_\Omega I$. The different overvoltages are also shown, the cell activation overvoltage $\eta_\text {act}$ as well as $\eta_\text {dif}$ with $\eta_\text {dif}=\eta_\text{dif,p} -\eta_\text{dif,n}$.
It must be noted that all overvoltages and the ohmic drop are negative values.

Figure 7: $U\; vs. -I$ characteristics for a fuel cell voltage in the presence of ohmic drop $U+R_\Omega I$, the theoretical cell voltage $U$, the contribution of the transfer voltage $U_\text {tr}$ and of the so-called diffusion overvoltage $\eta_\text{dif}$ and finally the ohmic drop $R_\Omega I$.
As it can be seen in figures above, assuming simple kinetics can lead to rather complex curves, also due to the fact that when making measurements on a full fuel cell, two interfaces are studied. The performance of a fuel cell can be characterized by a discharge curve (Figs. 4 and 7) but only the blue curves on these figures can be plotted, meaning that the different overvoltage contributions and possible ohmic drop cannot be accessed.
In this regard, characterization of fuel cells by Electrochemical Impedance Spectroscopy offers access to more information than polarisation curves.
EIS characterisation
Similar to a battery cell, the impedance of a fuel cell writes:
$$Z_\text {FC}=R_\Omega+Z_\text p+Z_\text n \tag{8}$$
With $R_\Omega$ the ohmic resistance, $Z_\text p$ and $Z_\text n$ the impedance of the positive and the negative electrodes, respectively.
EIS can provide information on each of these terms and on the mechanisms involved in the reactions.
$R_\Omega$ determination
EIS can easily lead to the determination of the ohmic resistance and consequently, used to calculate the ohmic drop. The method is the same as a battery and is described in details in the BioLogic Application Note 62 “ How to measure the ohmic resistance of a battery using EIS”
Study of the electrode reactions
Here we present a few papers that show how EIS can be successfully used to decipher electrode reactions controlling parameters in order to improve and optimize the performance of fuel cells.
- Relaxation impedance as a model for the deactivation mechanism of fuel cells due to carbon monoxide poisoning [5]
- Detection of membrane drying, fuel cell flooding, and anode catalyst poisoning on PEMFC stacks by Electrochemical Impedance Spectroscopy [6]
- Electrochemical Impedance Spectroscopy for direct methanol fuel cell diagnostics [7]
- Optimisation of air cooled, open-cathode fuel cells: current of lowest resistance and electro-thermal performance mapping [8]
- Inductive phenomena at low frequencies in impedance spectra of proton exchange membrane fuel cells – A review [9]
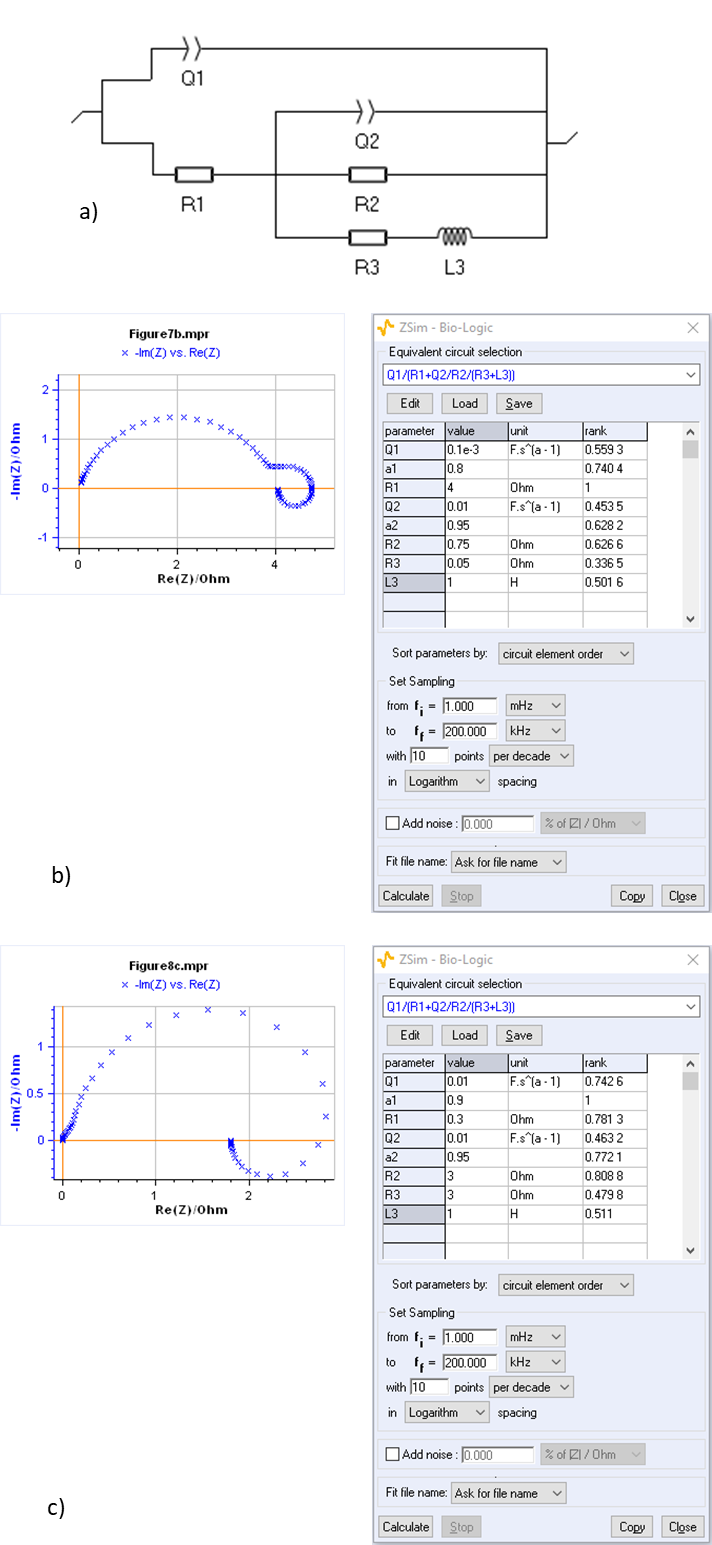
ZSim, the impedance simulation software in EC-Lab®, can be readily used to simulate typical curves such as the ones shown in [9], where reactions involve two absorbing species. EIS can be used to study reactions taking place at fuel cell electrodes, such as HER and OER reactions, which involve several adsorbed intermediate species and several electronic transfers, and do not follow Butler-Volmer kinetics. Examples of impedance graphs obtained on fuel cells are shown in Figure 8.

Figure 8: a) Equivalent circuit used to model the impedance graphs shown in [5, 7, 9]. Various sets of parameters can lead to very different Nyquist plot of the impedance as shown by Fig. 8b and 8c.
Electrolysers
In an electrolyser in operation, as in a recharging battery, the reaction taking place on the positive side is an oxidation and the positive side is an anode, and the reaction taking place on the negative side is a reduction, the negative side is a cathode. Electrolysers have a long history of industrial use: aluminum production, or chlorine production during the First World War (for phosgene production), this was the reason for the development of electrochemistry in the Grenoble (France) region, owing to easy access to electricity thanks to hydroelectric power plants in the area.
Among the various products produced by electrolysis, dihydrogen production now occupies a prominent place as a way to store energy intermittently produced by the sun, the wind or water, or overproduced by nuclear energy.
Figure 9 shows the operation principles of a PEM electrolyser. Contrary to a fuel cell, the redox reactions of interest do not occur spontaneously, and electrical energy is required. Some of the considered reactions are shown in the introductory article on fuel cells and electrolysers, in Eqs. 2 and 3, but they depend on whether acidic or basic conditions are used.
- In acidic conditions:
at the anodic or positive side
$$\text H_2 \text O \rightarrow \frac{1}{2}\text O_2 + 2\text H^+ + 2 \text e^- \tag{9}$$
at the cathodic or negative side
$$2\text H^++2\text e^-\rightarrow \text H_2\tag{10}$$
- In basic conditions
at the anodic or positive side
$$2\text {OH}^- \rightarrow \frac{1}{2}\text O_2 + \text H_2 \text O + 2\text e^-\tag{11}$$
at the cathodic or negative side
$$2\text H_2 \text O + 2 \text e^- \rightarrow \text H_2 +2\text {OH}^- \tag{12}$$
PEM electrolyzers use acidic aqueous solutions whereas alkaline water electrolysis and AEM (Anions Exchange Membranes) electrolysers use basic aqueous solutions.

Figure 9: Schematics describing a PEM electrolyser under operation.
Polarisation curves
Assuming Butler-Volmer kinetics
Eqs. 2 and 3 still hold in the case of electrolysers, but in this case the voltage applied is larger than the $\text {OCV}$ as seen in Figure 10. The same definitions also hold for the activation overvoltages but in this case $\eta_\text {act,p}>0$, $\eta_\text {act,n}<0$ and $\eta_\text {act}>0$.
Figure 10: $I\; vs. E$ characteristics for the positive and the negative electrodes of an electrolyser following Butler-Volmer kinetics. One can also see the activation overvoltages, the cell voltage $U$ and the Open Circuit Voltage $\text {OCV}$.

Figure 11 shows the evolution of the positive and negative potentials with the current, now positive. The voltage $U$ now increases with the current.

Figure 11: $I\; vs. E$ characteristics of the positive and the negative potentials as a function of the cell current for an electrolyser following Butler-Volmer kinetics. The cell voltage $U$ is also shown as well as the activation overvoltages at the positive and negative electrodes and the $\text {OCV}$.

Figure 12 shows the polarisation curve of a full electrolyser where Butler-Volmer kinetics apply and the ohmic drop $R_\Omega I$ is not negligible. The activation overvoltage $\eta_\text {act}$ of the cell is shown and is now a positive value, $\eta_\text {act}=\eta_\text p-\eta_\text n$.
Figure 12: $I\; vs. U$ characteristics of the fuel cell in the presence of an ohmic drop, the theoretical voltage $U$ and the ohmic drop $R_\Omega I$ for an electrolyser following Butler-Volmer kinetics.
Assuming Butler-Volmer kinetics with mass transport limitation
Similar to the fuel cell, Figure 13 describes the evolution of the electrodes potentials with the current, which is now positive. On the positive side, the limitation comes from the interfacial depletion of the reducing species ($\text {OH}^-$) and the limit current $i_\text {dR,p}$ is indicated. On the negative side, the limitation comes the interfacial depletion of the oxidizing species ($\text H^+$) and the limit current $i_\text {dO,n}$ is indicated.

Figure 13: $I\; vs. E$ characteristics of the positive and the negative electrodes for an electrolyser following Butler-Volmer kinetics with mass transport limitation. Blue curves: total Faradaic current, orange curves: electronic transfer current, green curves: diffusion current.
Similar to Fig. 7 for the fuel cell, Fig. 14 shows the $I\; vs. E$ characteristics of the electrode potentials, illustrating the evolution of the full electrolyser voltage, the activation overvoltage and the so-called diffusion overvoltage, defined as $E-E_\text{tr}-E_\text{th}=E-\eta_\text{act}$.
Finally, Fig. 15 is the equivalent of Fig. 8 for an electrolyser where the full electrolyser voltage is shown as well as the other contributions. Again, performing a simple polarisation curve only produces the blue curve shown in Fig. 15 and it might be difficult to separate the different contributions. In this regard, EIS can be seen as a much more powerful and insightful method.

Figure 14: $I\; vs. E$ characteristics of the positive (top curves) and the negative (bottom curves) potentials as a function of the cell current for an electrolyser following Butler-Volmer kinetics with mass transport limitation. The cell voltage $U$ is also shown. Blue curves: electrodes potential $E$, orange curves: charge transfer potential $E_\text {tr}$, as well as the corresponding overvoltages defined in the text.
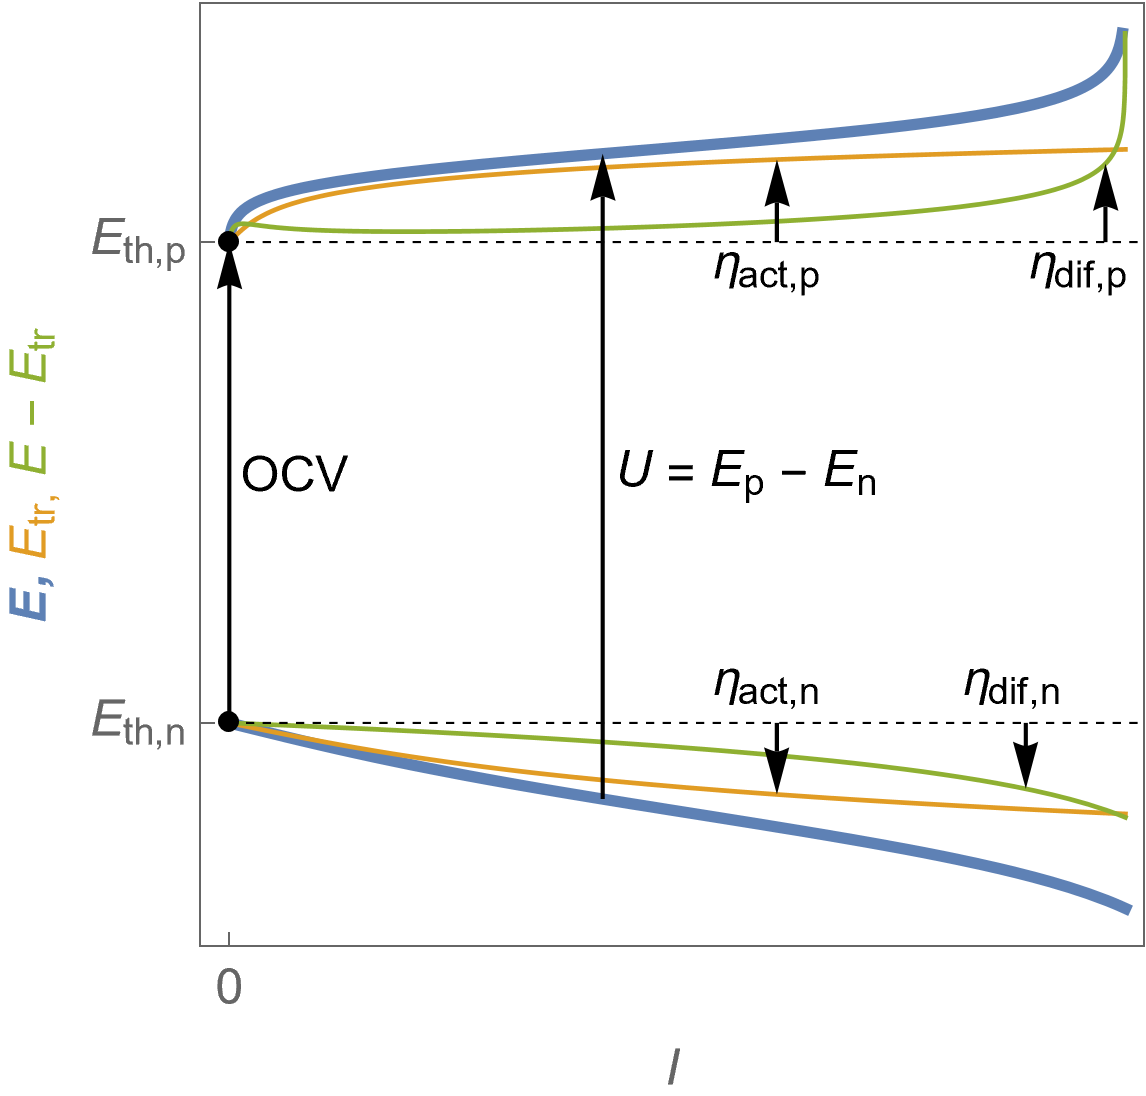
Figure 15: $U\; vs. I$ characteristics for an electrolyser in the presence of ohmic drop $U+R_\Omega I$, the theoretical cell voltage $U$, the contribution of the transfer voltage $U_\text {tr}$ and of the so-called diffusion overvoltage $\eta_\text {diff}$ and finally the ohmic drop $R_\Omega I$.

EIS characterisation
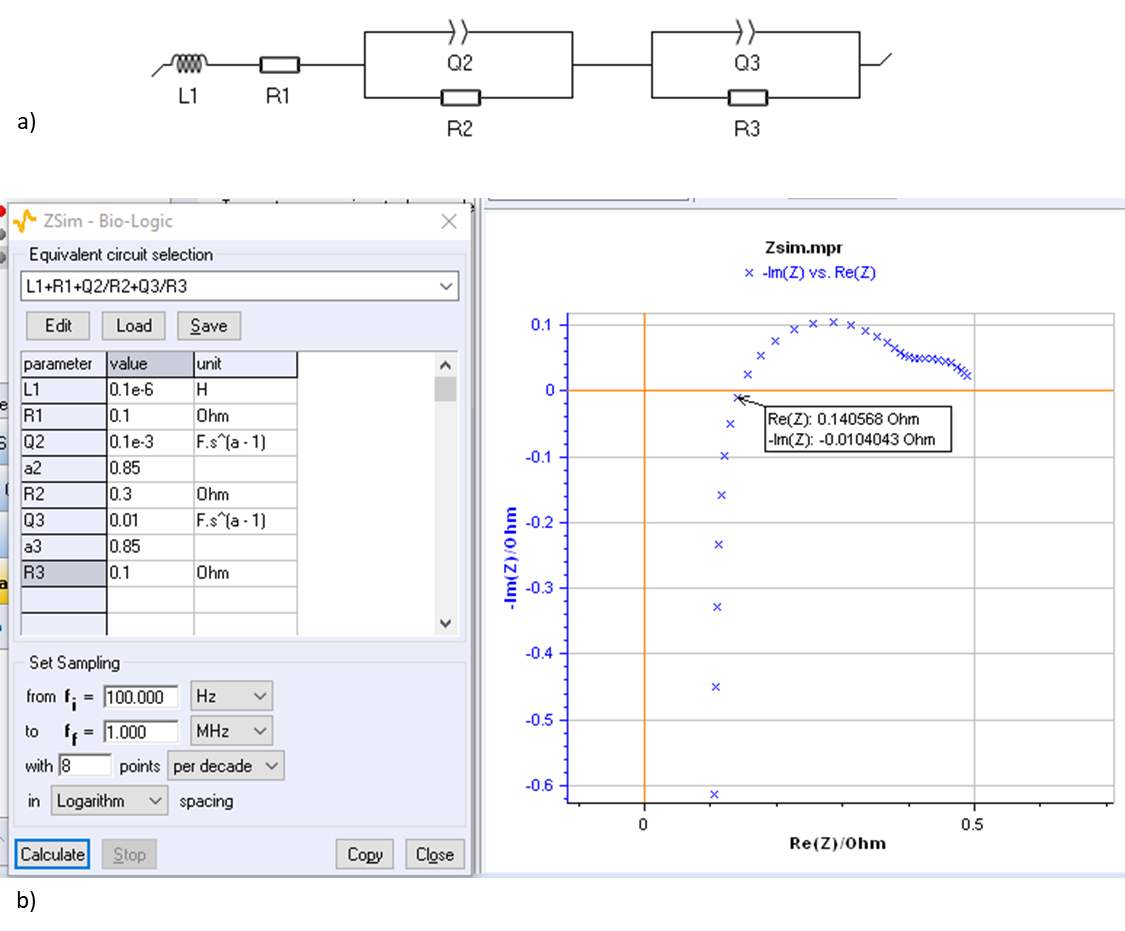
As with fuel cells, EIS can be used to study reactions taking place at electrolyser electrodes, such as HER and OER reactions. Examples of electrolyser impedance graphs are shown in Figure 16, and in BioLogic Application Note 63.

Figure 16: a) Equivalent circuit used to model the impedance graph shown in [10] obtained on an electrolyser and shown in b). It must be noted that using the real part of the impedance for an imaginary part close to 0 (0.14 Ω) is quite far from the theoretical value R1 (0.1 Ω).
$R_\Omega$ determination
Similar to a fuel cell, EIS can easily lead to the determination of the ohmic resistance and consequently, be used to calculate the ohmic drop. The method is the same as a battery and is described in details in the BioLogic Application Note 62 “ How to measure the ohmic resistance of a battery using EIS”.
Study of the electrode reactions
Polarisation curves cannot be used to characterize the electrochemical reactions taking place at the electrodes, i.e. its dynamic behaviour. Knowledge of this behaviour may become necessary, for example in order to control the operation of the electrolyser. The EIS method is widely used for this purpose. Here we give a few papers showing the usefulness of EIS and experimental EIS graphs obtained on electrolysers:
- Solid oxide electrolysis cell analysis by means of electrochemical impedance spectroscopy: A review [10].
- Electrochemical Impedance Spectroscopy as a diagnostic tool in polymer electrolyte membrane electrolysis [11].
- A platinum microreference electrode for impedance measurements in a PEM water electrolysis cell [12].
Conclusions
As it was seen above, using simple relationships to describe the kinetics of a fuel cell or an electrolyser (Butler-Volmer without or with mass transport limitation) leads to complicated operating curves where the different contributions of charge transfer and mass transport, as well as experimental effects such as the ohmic drop, cannot be easily separated. EIS should be used in combination with voltammetric techniques to have a better insight. The ohmic drop can be easily obtained and the determining parameters (mass transport, charge transfer) of the reaction kinetics can be studied and optimized.
It was seen that the behaviours of an electrolyser and a fuel cell are simply the opposite: the anode becomes the cathode, and the cathode becomes the anode, while the positive and negative electrodes keep the same polarity. Some researchers are focused on the development and study of a Unitized Reversible Fuel Cell (URFC) which is able to operate by conception in two modes: in fuel cell mode with production of electricity starting from fuel and oxidant, as well as in electrolyser mode, with production of fuel and oxidant starting from electricity [13-15]. This is illustrated in Fig. 17. In the case of reversible fuel cells, it would be preferable, as with batteries, to use the terms positive/negative and only anode/cathode when the operation mode of the Reversible (or Unitized) Fuel Cell is specified (FC or electrolyser operation).

Figure 17: Illustration of a Reversible Fuel Cell under operation.

References
[1] https://en.wikipedia.org/wiki/Solid_oxide_fuel_cell
[2] https://en.wikipedia.org/wiki/Direct methanol fuel cell
[3] https://www.britannica.com/technology/fuel-cell
[4] J.-P. Diard, B. Le Gorrec and C. Montella, Cinétique électrochimique, Hermann, Paris (1996)
[5] C. A. Schiller, F. Richter, E. Gülzow and N. Wagner, “Relaxation impedance as a model for the deactivation mechanism of fuel cells due to carbon monoxide poisoning” Phys. Chem. Chem. Phys., vol. 3, p. 2113, 2001.
[6] J.-M. Le Canut, R. M. Abouatallah and D. A. Harrington, “Detection of membrane drying, fuel cell flooding, and anode catalyst poisoning on PEMFC stacks by Electrochemical Impedance Spectroscopy” J. Electrochem. Soc., vol. 153 (5) p. A857, 2006.
[7] P. Piela, R. Fields and P. Zelenay,“Electrochemical Impedance Spectroscopy for direct methanol fuel cell diagnostics” J. Electrochem. Soc., 153 (10) A1902, 2006.
[8] Q. Meyer, K. Ronaszegi, G. Pei-June, O. Curnick, S. Ashton, T. Reisch, P. Adcock, P. R. Shearing and D. J. L. Brett, “Optimisation of air cooled, open-cathode fuel cells: current of lowest resistance and electro-thermal performance mapping” J. Power Sources, 291, p. 261, 2015.
[9] I. Pivac and F. Barbir, « Inductive phenomena at low frequencies in impedance spectra of
proton exchange membrane fuel cells – A review” J. Power Sources., 3026, p. 112, 2016.
[10] A. Nechache, M. Cassir and A. Ringuedé, “Solid oxide electrolysis cell analysis by means of electrochemical impedance spectroscopy: A review” J. Power Sources, 258, p. 164, 2014.
[11] S. Siracusano, S. Trocino, N. Briguglio, V. Baglio and A. S. Aricò “Electrochemical Impedance Spectroscopy as a diagnostic tool in polymer electrolyte membrane electrolysis” Materials, 11 (8) p. 1368, 2018.
[12] A. Hartig-Weiß, M. Bernt, A. Siebel and H. A. Gasteiger “A platinum microreference electrode for impedance measurements in a PEM water electrolysis cell” J. Electrochem. Soc., 168 (11) p. 114511, 2021.
[13] S. Rabih, O. Rallieres, C. Turpin and S. Astier “Experimental study of a PEM reversible fuel cell,” in International Conference On Renewable Energies And Power Quality (Icrepq’11) Las Palmas De Gran Canaria, p. 1, 2011.
[14] O. A. Marina, L. R. Pederson, M. C. Williams, G. W. Coey, K. D. Meinhardt, C. D. Nguyen and E. C. Thomsen “Electrode performance in reversible solid oxide fuel cells,” J. Electrochem. Soc., vol. 154, p. B452, 2007.
[15] N. Q. Minh and M. B. Mogensen “Reversible solid oxide fuel cell technology for green fuel and power production”, The Electrochemical Society Interface, 22, p. 55 2013.


