

DC and AC characterization of a Vanadium Redox Flow Battery (VRFB) using a Pinflow 20 cm² test lab cell Battery – Application Note 71
Latest updated: December 9, 2024Introduction
Redox Flow Batteries (RFBs) stand out from all electrochemical energy storage systems as a highly attractive candidate for the following reasons:
i) a low Levelized Cost Of Storage (LCOS), which includes investment and servicing cost;
ii) great flexibility in terms of power (number and size of cells) and energy (amount of available energy storage medium i.e. redox electrolyte);
iii) the fact that a single cell or a stack can be used for the reversible operation (charging and discharging) [1].
Among the various technologies that are available, vanadium redox couples (VV and VIV for the positive electrode, VII and VIII for the negative electrode) present a remarkable durability mainly due to: i) the absence of mutual contamination of electrolytes (both electrolytes on the positive and negative side of the cell contain vanadium), ii) the absence of volume changes of the electrodes related to metal plating or ion insertion (both electrolytes react at inert electrodes and remain liquid) [2].
In this application note, a Vanadium Redox Flow Battery (VRFB) was characterized using typical DC and AC techniques: galvanostatic charge and discharge cycling and Electrochemical Impedance Spectroscopy (EIS).
VRFB principles
Figure 1 shows the schematic of a Redox Flow Battery (RFB). As in the case for any electrochemical device system, the RFB converts electrochemical energy into electricity. Unlike conventional batteries, like Li-ion or Ni-Cd batteries, which are closed systems where the storage and conversion of energy take place in the same place, RFBs, like fuel cells, are open systems where energy conversion and storage are separated. The electrochemical energy is stored in the electrolytes, in the form of a redox Nernst potential difference between both electrolytes. 
Figure 1: Schematics of a Redox Flow Battery (RFB).
In the case of a VRFB, the electrolyte on the positive side of the cell or “catholyte”
The following reactions take place at the positive inert
$${\rm VO}_2^+ + 2{\rm H}^+ + e^- \rightleftharpoons {\rm VO}^{2+}\ + {\rm H_2O}\tag{1}$$
involving VVand VIVspecies, and at the negative inert electrode,
$${\rm V}^{2+} \rightleftharpoons {\rm V}^{3+} + e^-\tag{2}$$
During discharge:
- the reaction described in Eq. 1 takes place in the reduction direction at the positive electrode and the redox potential of the posilyte decreases,
- the reaction described in Eq. 2 takes place in the oxidation direction at the positive electrode and the redox potential of the negalyte increases.
The reverse reactions take place during charge.
The electrodes are typically inert carbon felts and are only used to transfer electrons. The active materials are actually redox pairs, that is to say chemical compounds that can uptake and release electrons. The liquids containing these redox pairs are separated by an ion exchange membrane so that the mixing does not occur, which would be equivalent as short-circuiting the two poles of the battery. However, ion exchange is possible through the membrane to allow for a charge balance between the two half-cells or battery poles. In reality, electrolyte cross-over always happen to a small extent, which leads to the battery self-discharge and a reduced Coulombic Efficiency (CE?), which is defined below.
In VRFBs, the exchanged ion is H+ if the membrane is a cation exchange membrane, as shown in Figure 1. In the case of an anion-exchange membrane, the main charge carriers are SO42-and HSO4–.
Because the energy conversion and the energy storage are separated, it is possible to independently size the power and the energy of the battery. The energy (or capacity) of the battery is related to the size of the tanks that store the electrolytes. The larger the tanks, the larger the charge that can be delivered by the battery.
The battery power depends on the electrode size i.e. the current and the emf (electromotive force) of the full cell (Figure 2a). Increasing the electrode area and/or using a stack of cells leads to an increase in the battery power (Figure 2b). 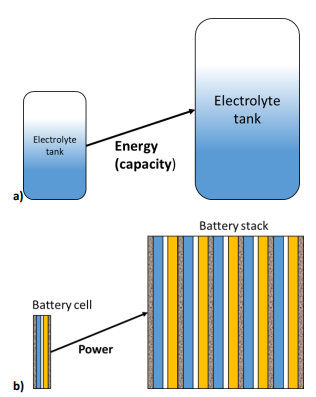
Figure 2: In RFBs the energy and the power of a device can be separately tailored: a) increasing the size of the electrolytes tank increases the battery capacity, while b) increasing the size or the number of cells increases the power.
Experimental conditions
A Pinflow® test lab cell with 20 cm² active area was used with Pinflow® graphite felt electrodes and Nafion 115 membrane. The scheme below (Figure 3) describes the various parts of the cell. The electrolyte flow was performed by two Watson Marlows pumps 323S with pump heads 313X and 313DW. 
Figure 3: Exploded view of the Pinflow® RFB test cell
The characterization of the lab cell was performed using a typical commercial electrolyte comprising 0.8 mol·L-1 of V3+ and VO2+, 2 mol·L-1 H2SO4 and 0.3 wt.% H3PO4 from GfE, (Gesellschaft für Elektrometallurgie GmbH) as the initial posilyte and negalyte, then 58.3 mL of the electrolyte was introduced in each branch of the electrolyte circuit. The corresponding theoretical capacity can be calculated using the following formula derived from the Faraday law:
$$Q = nCV{\rm F}\tag{3}$$
With ? the capacity in C or mAh contained by a volume ? in L-1 of electrolyte with a concentration ? in mol·L-1 of active species involving ? electrons, and F the Faraday constant in C·mol-1.
In the conditions described above:
$$? = 58.3 x 10^{-3} × 0.8 × 96485/3.6 = 1250 mAh$$
Nitrogen gas was bubbled through the negative electrolyte to prevent its self discharge due to the oxidation of VII ions by oxygen from air.
With an equimolar concentration of V3+ and VO2+ ions in both compartments, the battery SoC is at -50%. The negative SoC can be understood by looking at Table 1, which summarizes the content of each electrolyte with respect to the SoC of the battery. N represents a given number of moles. VO2+and VO2+correspond to VIV and VV oxidation states, respectively.
Given that ?0 is the charge necessary to increment of +1, the oxidation state of 1 mol of V ions, the negative SoC is explained by the fact that a charge ?0 must pass in the posilyte and the negalyte with the initial electrolyte to reach an SoC of 0.
During this first step of the initial charge, going from -50% SoC to 0% SoC, the following reaction takes place at the positive electrode:
$${\rm V}^{3+} + {\rm H_2O} \rightarrow {\rm VO}^{2+} + e^- + {\rm 2H^+}\tag{4}$$
The same reaction occurs in the opposite direction at the negative electrode.
Table 1: The quantity of vanadium ions in both poles of the VRFB as a function of SoC. 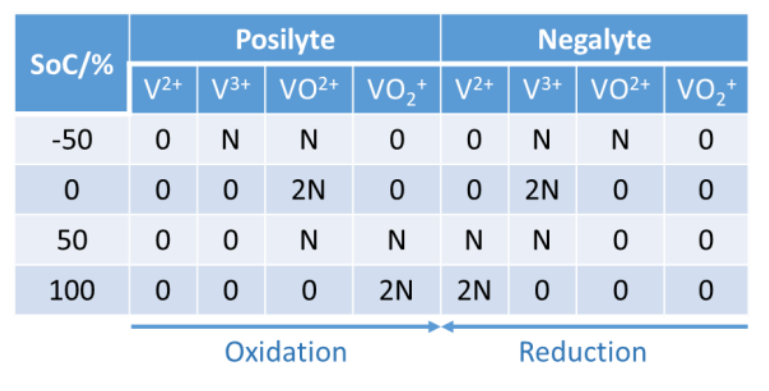 A BCS-815 from BioLogic was used to perform the DC pre-charge and cycling experiments. A VSP-300 was used to perform EIS experiments
Results
Charge to +50% SoC
A current of 3 A was applied to the cell, using a 4-point connection mode with a charge limit of 2500 mAh and a potential limit of 1.65 V. A charge quantity of 2500 mAh allows to go from SoC of -50% to an SoC of 50%. When one or the other limit is reached the experiment stops. The graph below shows the initial pre-charging curve (Figure 4), the charge limit was reached first. The electrolyte was flowing at a rate of 40 mL min-1, which is a typical operating value at a temperature of 25 °C.
The initial increase corresponds to the battery activation. The voltage increases at around 1000 and 1200 s correspond to electrolyte conversion. The drop at the end corresponds to an OCV period.
 Figure 4: Galvanostatic pre-charging curve, 3 A with a 2500 mAh charge limit and 1.65 V potential limit
 Figure 4: Galvanostatic pre-charging curve, 3 A with a 2500 mAh charge limit and 1.65 V potential limit
Cycling
To investigate and demonstrate the cyclability of VRFB, galvanostatic charges and discharges were repeatedly performed. A 3 A charge and discharge current, corresponding to 150 mA cm-2 current density, was applied to the cell, with charging and discharging potential limits of 1.65 and 0.8 V, respectively (Figure 5a). Please note that only the first 6.5 cycles are shown, over a total of 71 cycles (Figure 5b). Figure 5b shows the Coulombic Efficiency CE? of the galvanostatic cycling, which is defined by the following formula:
$${\rm CE}_{n} = \left|\frac{Q_{{\rm dis}_{n}}}{Q_{{\rm ch}_{n}}}\right|\tag{5}$$
It represents the ratio of charge released during the discharge (?disn) to the charge necessary for charging the battery (?chn) at a given charge/discharge cycle ?.
It can be seen that after 10 cycles the coulombic efficiency evolves between 96 and 96.5 %, which proves the very good cyclability of VRFBs.

 Figure 5: a) Cycling curves at 3/-3 A charge/discharge with potential limits at 1.65 V and 0.8 V. Only 6.5 cycles are shown over a total of 71.; b) Efficiency vs. cycle number.

 Figure 5: a) Cycling curves at 3/-3 A charge/discharge with potential limits at 1.65 V and 0.8 V. Only 6.5 cycles are shown over a total of 71.; b) Efficiency vs. cycle number.
Other parameters can be used to estimate the cyclability and the capacity retention: for example one can plot the discharge capacity vs. cycle number as shown in Figure 6. Qdischarge is readily available in the variables list. From this curve, one can determine a discharge capacity loss, using the Linear Fit tool available in BT-Lab® (and EC-Lab®). In our case, the capacity retention is estimated to be around -4.2 mAh/cycle.
Two other parameters can also be useful, the Energy Efficiency (EE?) and the Voltage Efficiency (VE?), whose formula are
$${\rm EE}_{n} = \left|\frac{E_{{\rm dis}_{n}}}{E_{{\rm ch}_{n}}}\right|/tag{6}$$
with ?disn and ?chn the discharge and charge energy, respectively, at a given cycle ?, and
$${\rm VE}_{n} = \left|\frac{{\rm EE}_{n}}{{\rm CE}_{n}}\right|\tag{7}$$
respectively.
 Figure 6: a) The discharge capacity is readily available in the variables list ; b) Discharge capacity vs. cycle number for the data shown in Fig. 5a, with discharge capacity loss obtained by fitting one part of the curve with the Linear Fit tool in BT-Lab® (also available in EC-Lab®).
 Figure 6: a) The discharge capacity is readily available in the variables list ; b) Discharge capacity vs. cycle number for the data shown in Fig. 5a, with discharge capacity loss obtained by fitting one part of the curve with the Linear Fit tool in BT-Lab® (also available in EC-Lab®).
?disnand ?chncan be readily plotted in BT-Lab® (or EC-Lab®) as the energy is a built-in variable, as it can be seen in Figure 7. To obtain EEn and VEn, one needs to export these variables into a .mpt file and do the maths using a separate software package.

Figure 7: ?disnand ?chnvs. cycle number for the results shown in Fig. 5.

The various efficiencies can be affected by different factors:
• CE?:
– Active species cross-over or degradation,
– Parasitic electrode reactions such as Hydrogen Evolution Reaction (HER), Oxygen Evolution Reaction (OER),
– Self-discharge reaction of charged species with atmospheric oxygen, all leading to electrolyte SoC unbalance.
• VE?:
– Increased cell resistance due to electrode deactivation,
– Increased membrane resistance
– Electrolyte unbalance. All factors can affect EE?.
EIS
For various SoCs
Figure 8a and 8b show the Nyquist diagram of the impedance data obtained on a VRFB at -50% and +50% SoC, respectively. The PEIS technique was used with 5 mV amplitude around OCV scanning from 200 kHz to 50 mHz with 6 frequency points per decade.
 Figure 8: × Nyquist diagram of the impedance of a VRFB at with an electrolyte flow rate of 40 mL min-1; ̶― fitting line using the equivalent circuit and parameters described in the text, a) -50% SoC, b) at 50% SoC
 Figure 8: × Nyquist diagram of the impedance of a VRFB at with an electrolyte flow rate of 40 mL min-1; ̶― fitting line using the equivalent circuit and parameters described in the text, a) -50% SoC, b) at 50% SoC
Similarly to a rotating disk electrode or a fuel cell, in RFBs, the reaction kinetics are dependent on the electroactive species interfacial concentrations, themselves dependent on electrolyte mass transport, in these systems, diffusion and convection.
The electroactive species concentration profiles follow that of a bounded diffusion as described in more details in the Application Note 66 [4].
The impedance element that corresponds to the Nernst approximation of such profile is Wδ, which we will use to fit the low-frequency impedance data shown in Figure 8. The equivalent circuit used to fit the data is the following: L1+R1+Q1/(Wd2+R2) (Figure 9). 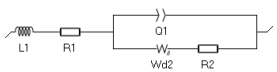
Figure 9: Equivalent circuit used to fit the impedance data shown throughout this paper.
L1 corresponds to the inductance related to the cell used to perform the measurement. It is very important to plot and fit the inductance to accurately determine the values of the other parameters, as described in the application note on this subject [5] and the corresponding BioLogic topic on the same subject [6]. R1 corresponds to the ohmic resistance, Q1 corresponds to the distributed double layer capacitance, R2 to the charge transfer resistance.
The fitting results are given in Table 2. All parameters related to the low frequency part of the impedance have drastically varied due to the SoC change, as could be inferred from the appearance of the impedance graph, more precisely the diffusion time constant td and the diffusion resistance Rd [4]. The pseudo-capacitance also drastically changed. The “electronic” parameters (ohmic resistance, inductance) varied to a lesser extent, as well as the charge transfer resistance R2.
Table 2: Fitting results of the impedance Nyquist graphs shown in Figure 6a and 6b using the equivalent circuit shown in Figure 9. The first line shows the different SoCs of the battery and the relative difference ∆ of the fitting results (∆ = (final value-initial value)/initial value).

For various flow rates.
In the next part, several impedance graphs were plotted with various flow rates using GEIS technique and a 10 mV amplitude around OCV, from 100 kHz to 5 mHz, with 6 points per decade. The results are shown in Figure 10.
 Figure 10: Nyquist diagrams of impedance obtained on VRFBs for various electrolyte flow rates as indicated on the graph.
 Figure 10: Nyquist diagrams of impedance obtained on VRFBs for various electrolyte flow rates as indicated on the graph.
Using the same equivalent circuit as before (Figure 9), the graphs shown in Figure 10 were fitted. The results are shown in Table 3.
Table 3: Fitting results of the impedance Nyquist graphs shown in Figure 10 using the equivalent circuit shown in Figure 9. The first line shows the various flow rates used in mL min-1. 
Following the same rationale as for an RDE [4], it can be expected that the diffusion time constant is proportional to the inverse of the flow rate, therefore we try to plot ?d ??. 1/?v where ?v is the volumic flow rate in mL·min-1. The results are shown in Figure 11.
There seems to be a linear relationship, confirming our expectations. However, the slope cannot be used to derive the diffusion constant as a hydrodynamic description of an RFB electrode is, to our knowledge, not yet available and would probably be specific to each type of graphite felt electrode.

Figure 11: Diffusion time constants obtained by fitting EIS data shown in Figure 10, plotted as a function of the inverse of the flow rate.
However, as an example, we can mention the work by G. Barral [7], whose EIS study was performed on a filter-press cell where the characteristic frequency is given by
$$f_{\rm c} = \frac{2.54}{2\pi\tau_{\rm d}} = kv_0^{1.4}\tag{8}$$
with ?0 the flow velocity in cm s-1.
Conclusion
In this application note, we have introduced Vanadium Redox Battery Cells and demonstrated that they could be characterized using BioLogic BCS-815 and VSP-300 instruments and a Pinflow® 20 cm² test cell. We presented DC cycling curves and various indicators that can be used to assess the battery quality. We also showed EIS data at various SoCs and various flow rates, showing a correlation between the diffusion time constant and the flow rate, indicating a bounded diffusion process.
Acknowledgements
BioLogic would like to thank Jiří Vrána and František Moulis from Pinflow as well as Petr Mazúr and Jiří Charvát from UCT Prague for providing the results, commenting and editing this application note.
References
1) J. Noack, N. Roznyatovskaya, C. Menictas, M. Skylla-Kazacos, Redox flow batteries for renewable energy storage, pv-tech.org, (Nov. 2019) 106 https://store.pv-tech.org/store/redox-flowbatteries-for-renewable-energy-storage/
2) P. Mazúr, J. Mrlik, J. Pocedic, J. Vrána, J. Dundalek, J. Kosek, T. Bystron, J. Power Sources 414 (2019) 354
3) P. Mazúr, J. Mrlik, J. Charvát, J. Pocedic, J. Vrána, J. Dundalek, J. Kosek, MethodsX 6 (2019) 534
4) Application Note 66 – EIS measurements on a RDE Part I: Determination of a diffusion coefficient using the new element Winf
5) Application note 62 – How to measure the internal resistance of a battery using EIS.
6) BioLogic’s learning center topic: ZSim and ZFit as learning tools. IV. The effect of high frequency inductance.
7) G. Barral, S. Maximovitch, C. Montella, J. App. Electrochem. 21 (1991) 991
Revised in 11/2021


