

High current (DC and EIS) measurements on electrolyzers Electrolyzers – Application Note 63
Latest updated: January 31, 2024Abstract
Proton Exchange Membrane Water Electrolyzers (PEMWE) are used for hydrogen production with the purpose of storing excess electricity from renewable energy sources. This hydrogen can then be re-used to produce electricity for the grid again, for Power-to-Gas, or for hydrogen mobility (fuel cell cars, etc). This technology requires high current densities and power for efficient conversion ratio. In this application note, the connection of the cell to the instruments and the software settings are described. The resulting data of the measurements are briefly discussed.
Introduction
Proton Exchange Membrane Water Electrolyzers (PEMWE) are used for hydrogen production with the purpose of storing excess electricity from renewable energy sources. This hydrogen can then be re-used to produce electricity for the grid, for Power-to-Gas, or for hydrogen mobility (fuel cell cars, etc). This technology requires high current densities and power for an efficient conversion ratio [1,2]. In this context, BioLogic is expanding its FlexP series dedicated to high power applications.
In this application note, the connection of the cell to the instruments and the software settings are described. The resulting data of the measurements are briefly discussed.
Experimental set-up
Measuring hardware
The following instruments are required (Fig. 1):
- The FlexP 0012 booster is connected to electrolyzer.
- The SP-150 manages the FlexP 0012.

Figure 1: Hardware setup. SP-150 connected to the Current booster (FlexP 0012) and FlexP 0012 connected to the electrolyzer.

The electrolyzer
The electrolyzer under test is a single cell of 250 cm2, circular design. The fluidic aspects of the electrolyzer are managed by a separate test station.
Safety considerations
Electrolyzer is a high-energy device so safety precautions must be applied.
- Personal Protective Equipment (PPE) must be used, such as gloves and a mask.
- IP2X connectors are mandatory. First connect the cable to the booster and then to the battery pack.
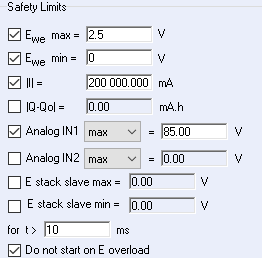
- The safety limits in EC-Lab® must be set appropriately (Fig. 2). It is highly recommended to set the voltage range, the maximum current and the maximum temperature.

Figure 2: Safety limits in Advanced Settings.
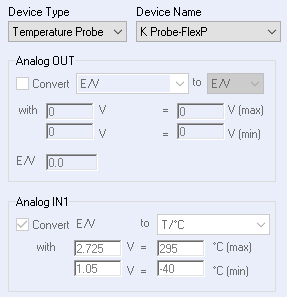
FlexP 0012 includes a K-type thermocouple that manages the temperature recording. This option is automatically set in EC-Lab® (Fig. 3).

Figure 3: Temperature settings in the External device tab.
Data discussion
Polarization curve (galvano-dynamic)
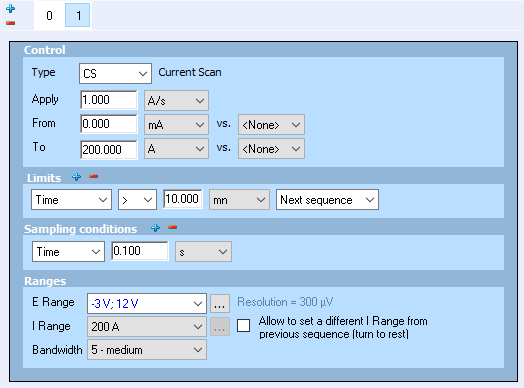
After a rest of 1 minute, a current scan of 1 A/s was applied with a ModuloBat (MB) technique in the Current Scan (CS) mode to the cell up to a current of 200 A (Fig. 4).

Figure 4: Settings of current scan at 1 A/s with a ModuloBat (MB) technique in the Current Scan (CS) mode.
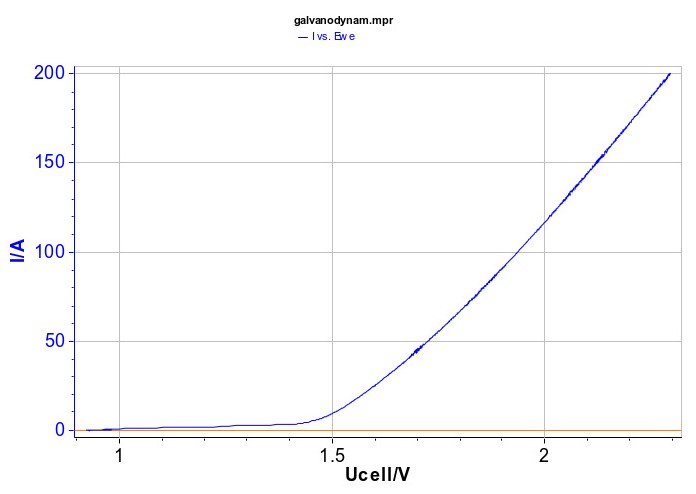
The resulting curve (Fig. 5) is typical of a high ohmic drop behavior.

Figure 5: Resulting polarization curve in Galvano-dynamic mode at 1 A/s.
EIS along the voltage range
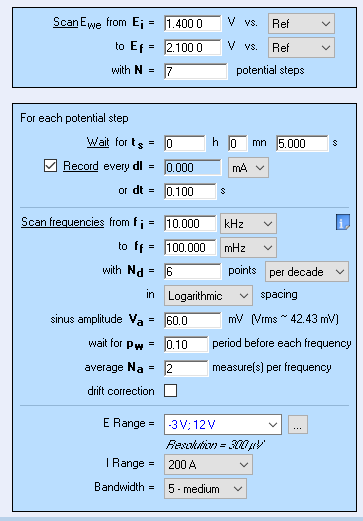
An EIS in potentio mode was performed in the voltage range of interest i.e. 1.4 V to 2.1 V (Fig. 6).

Figure 6: Settings of the SPEIS.
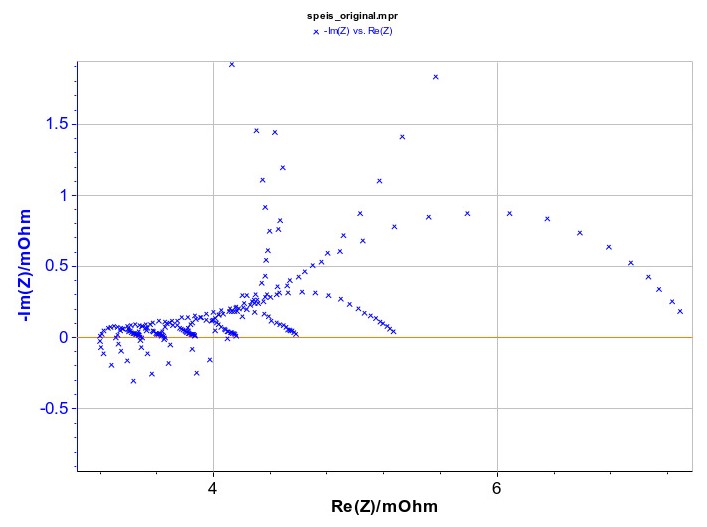
An inductive effect is noticed at high frequency (Fig. 7), it is due to the connection.

Figure 7: SPEIS data. Cycle 6 at 1.90 V.
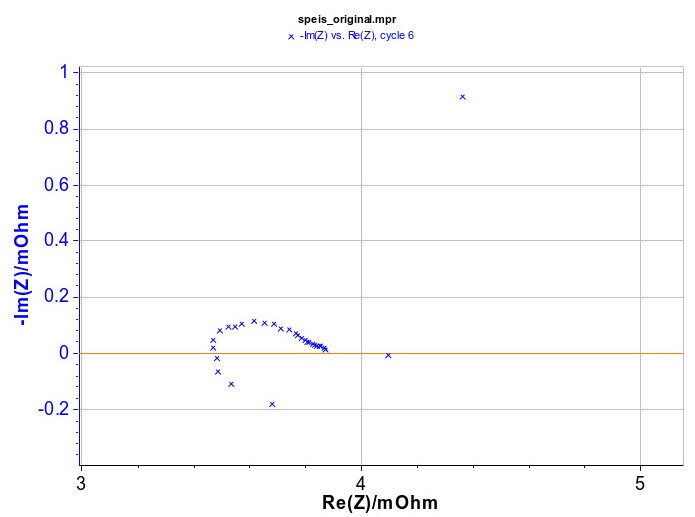
For the remaining part of this note, the EIS data are fitted by R1+R2/Q2 circuit. R1 is the ohmic resistance contribution and R2 the polarization resistance.


Figure 8: SPEIS data. Zoom at the high frequency region (below).

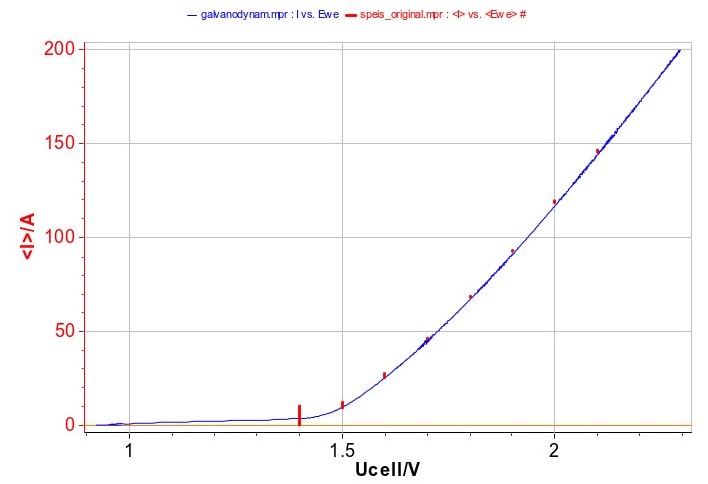
The polarization obtained during the EIS measurement (SPEIS) and by polarization (Current Scan) can be compared. Fig. 9 shows that the I vs. Ucell curve are pretty much the same.

Figure 9: Current vs. voltage form Galvano (blue line) and SPEIS data (red).
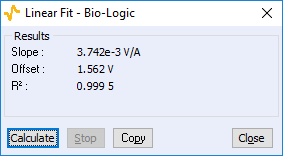
Moreover, the inverse of the slope of the current vs. voltage of the polarization curve and the resistance measured by EIS at low frequency have to be similar. The slope of the stationary curve is fitted with the Linear Fit tool at 2.0 V up to 2.1 V where the I vs. Ucell curve is considered to be linear. The range of the Linear Fit is ± 60 mV (Fig.10).

Figure 10: Example of linear fit at 2.00 V ± 60 mV.
The data are summarized in Tab. I. There is a good agreement between the two sets of data.
Table I Comparison of EIS and Galvano-dynamic data.
| EIS data | Galvano dynamic | |||
|---|---|---|---|---|
| R1/ mΩ | R2/ mΩ | R1+R2/ mΩ | slope/mΩ | |
| 2.0 V | 3.2 | 0.4 | 3.6 | 3.7 |
| 2.1 V | 3.2 | 0.3 | 3.5 | 3.6 |
Conclusion
The shape of the I-V curve is coherent with the literature [3].
These results show that the power capability of the FlexP 0012 allows the user to perform high current density measurements to study transport phenomenon limitations, for example current density up to 8 A/cm2 on 25 cm2 cells i.e. 200 A in absolute current.
As FlexP 0012 is a booster, it can manage positive and negative currents, meaning the same measurements are possible with fuel cells, as well as large cells of supercapacitors or batteries.
Data files can be found in:
C:\Users\xxx\Documents\EC-Lab\Data\Samples\Battery\AN_63_X
ACKNOWLEDGMENTS
The measurements were performed at the CEA-LITEN, supervised by B. Verdin, F. Fouda-Onana, P.A. Jacques & S. Benoit.
References
- F. Barbir, Sol. Energy, vol. 78, 5, (2005) 661.
- Tom Smolinka – Fraunhofer ISE / Germany, Magnus Thomassen – SINTEF / Norway, Alejandro Oyarce – SINTEF / Norway, and Frederic Marchal – ITM / United Kingdom, MEGASTACK: Stack Design for a Megawatt Scale PEM Electrolyser, 01-Dec-2016.
- C. K. Mittelsteadt, ECS Trans., 69, 17, (2015) 205.
- Application Note #49 “EIS measurements: Potentio (PEIS) vs. Galvano (GEIS) mode”
Revised in 08/2019


