

Distribution of Relaxation Times (DRT): how to identify equivalent circuits efficiently
Latest updated: November 18, 2024Using DRT as a means of identifying equivalent circuits efficiently
Electrochemical Impedance Spectroscopy (EIS) is used to identify the physical characteristics of a system. The method used is to model the system using what is called an equivalent electrical circuit, where each element of the circuit is supposed to correspond to a physical characteristic of the system under study. The choice of an electrical circuit requires prior knowledge of the impedance of the system, which can be an obstacle for this method.
Distribution of Relaxation Times (DRT) is an analysis method that turns impedance data that are a function of the frequency into a distribution of the time constants of the considered system. As DRT does not require prior knowledge of the system, it can be considered an important tool to help identify an equivalent circuit that should be used to fit impedance data.
The main advantage of DRT
We are using Z Sim, the EC-Lab® simulation software to simulate the Nyquist impedance diagram of the following electrical equivalent circuit: Q1/R1 + Q2/R2. The parameters are given in Fig. 1a and the Nyquist diagram in Fig. 1b.
Without any prior knowledge of the system, one could consider that there is only one time constant involved and try to fit these data using an electrical equivalent circuit: Q1/R1. The results are shown in Fig. 2. Figure 2a shows the calculated parameters and Fig. 2b the fitted data. You can see that the calculated parameters are nowhere near the correct parameters, as they are shown in Fig. 1a.
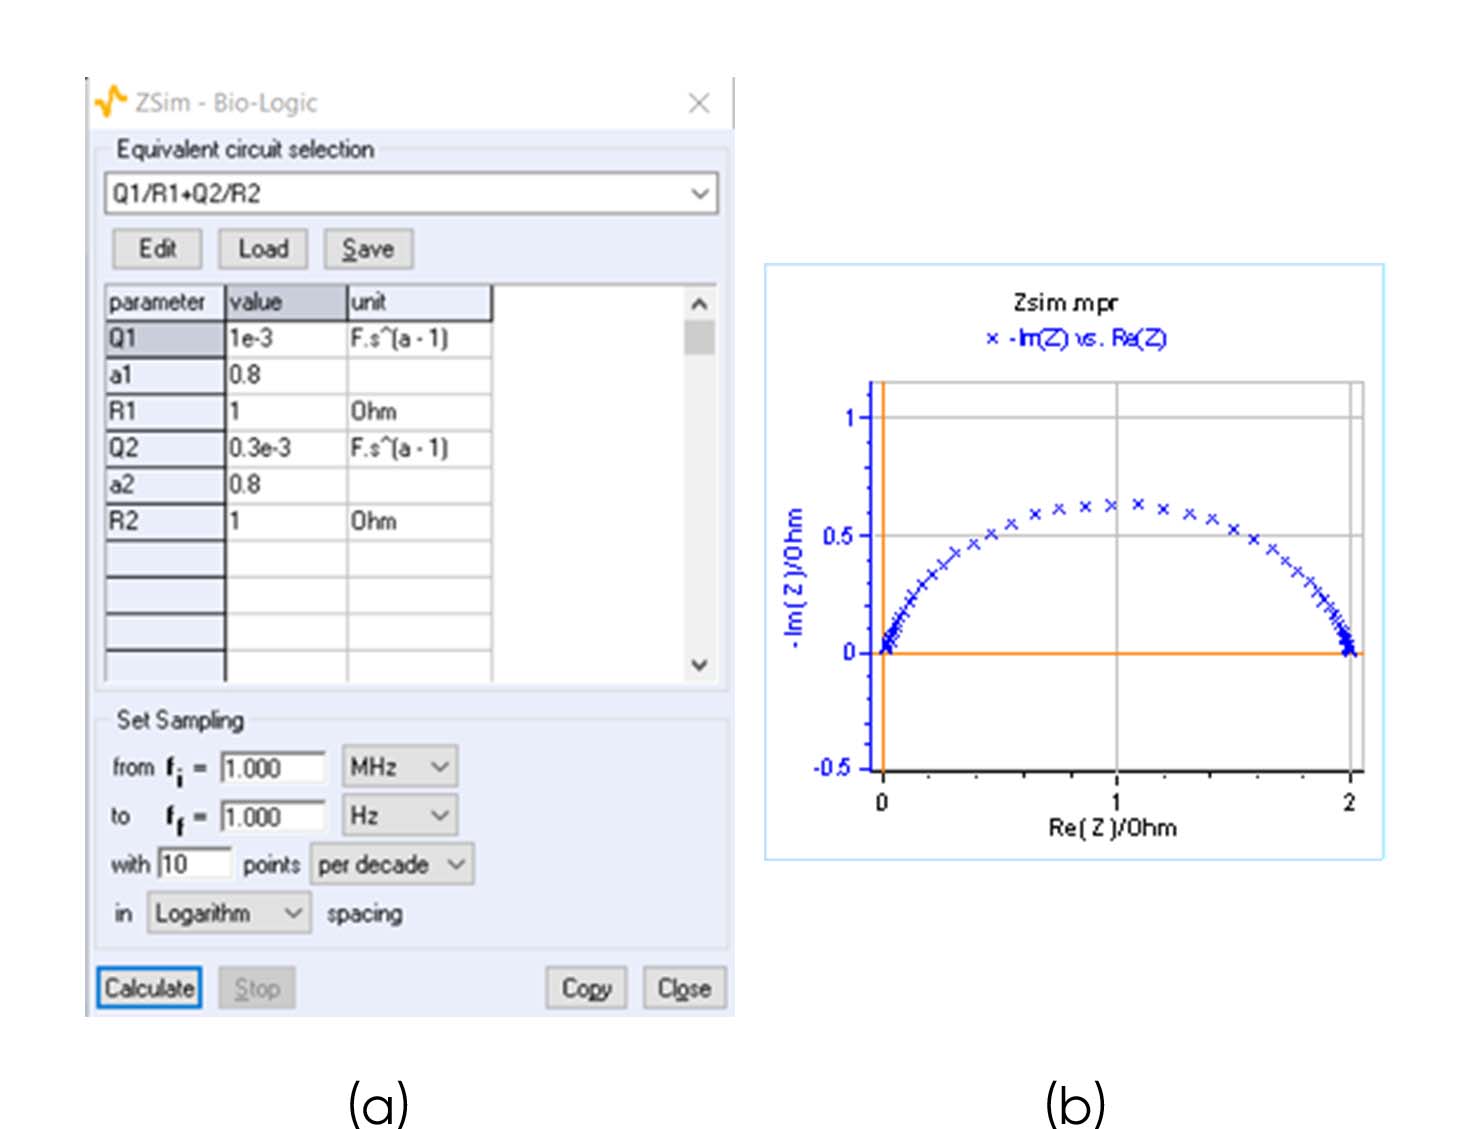
Figure 1: a) Parameters used to simulate the Nyquist diagram of the equivalent circuit Q1/R1 + Q2/R2 shown in b)

Figure 2: a) Fitting results obtained when fitting the impedance data shown in Fig. 1b with Q1/R1 as an equivalent circuit. b) Fitted impedance diagram.
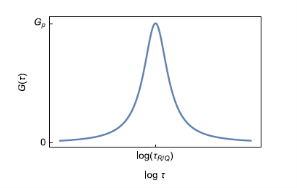
Using the DRT analysis, for example, by using the DRTtools freeware [1] developed by Dr. Wan, one can plot Figure 3, where the impedance data of Figure 1b are shown as the magnitude $G(\tau)$ vs. the relaxation times. The fact that we can see two peaks indicate that there are two time constants, that is to say, that the system is composed of two Q/Rs and not one Q/R.

Figure 3: Numerical DRT for the impedance results shown in Fig. 1b.
Figure 4 shows on the left the Nyquist impedance graphs of a Q1/R1+Q2/R2 equivalent circuit and on the right, the corresponding DRT plots for various ${\tau_1}/{\tau_2}$ ratios, with $\tau = (RQ)^{(1/\alpha)}$. $\alpha$, the so-called dispersion parameter, and $R$ are equally chosen for the two Q/R circuits, as presented in Fig. 1a, and only $Q2$ changes.
From ${\tau_1}/{\tau_2}=3.98$, the Nyquist plot of the impedance data shows what could be seen as a single depressed semi-circle, whereas the DRT plot shows two peaks.

Figure 4: the Nyquist impedance graphs of an Q1/R1+Q2/R2 equivalent circuit and on the right the corresponding
DRT plots for various ${\tau_1}/{\tau_2}$ ratios.
Each R/C circuit has a finite impedance limit when frequencies tend to either 0 or to +∞, hence the DRT analysis can only be successfully performed on data that present the same characteristics.
If data present an inductive behavior, either at low or high frequencies, or the system is governed by semi-infinite or restricted diffusion at lower frequencies, these unwanted data must be discarded for the DRT analysis to work [2,3]. The DRTtools program offers the possibility to account for inductive data [1].
DRT analysis finds its best use in the field of fuel cells, where low-frequency processes are generally governed by diffusion/convection, with a finite impedance limit at low frequencies [4,5].
Another limitation of the DRT analysis is that it requires a numerical matrix inversion and the results may depend on the method chosen for the inversion [6].
Please find more details about DRT in the referenced papers and our application note [7].
[1] DRTtools and its manual, https://github.com/ciuccislab
[2] J. Illig, M. Ender, T. Chrobak, J. P. Schmidt, D. Klotz, and E. Ivers-Tiff´ee, J. Electrochem. Soc., 159, 7 (2012) A952-A960
[3] J. P. Schmidt, E. Ivers-Tiff´ee, J. Power Sources, 315 (2016) 316 – 323
[4] H. Schichlein, A. C. Müller, M. Voigths, A. Krügel, and E. Ivers-Tiff´ee, J. Applied Electrochem., 32 (2002) 875- 882
[5] C. M. Rangel V. V. Lopes and A. Q. Novais. IV Iberian Symposium on Hydrogen, Fuel Cells and Advanced Batteries, Estoril, Portugal, 2013
[6] B. A. Boukamp, J. Phys. Energy 2 (2020) 1
[7] Distribution of Relaxation Times (DRT): an introduction


