

The Faraday Cage: What is it and how does it work?
Latest updated: November 18, 2024Introduction: What does a Faraday Cage do? How is a Faraday Cage used in electrochemistry?
Michael Faraday (1791-1867) is well known by physicists and electrochemists for his immense contribution to the understanding of electromagnetism, diamagnetism, and electrolysis.
His name was given to a constant, $F$, equal to $ca. 96485.3\,\text{C mol}^{-1}$, which corresponds to the charge of one mole of elementary charge. It was also given to a law, which converts a quantity of electricity into a quantity of matter, produced or consumed by an electrochemical redox reaction [1].
The Faraday cage, which is used to prevent sensitive electrical measurements from being affected by external electromagnetic fieldsa, is also named after him. These electromagnetic fields can originate from any instrument powered by the grid in the vicinity of the system or device that is being measured: plugged-in laptops, magnetic stirrers, potentiostats, climate chambers, phones, antennas, etc. Such electromagnetic fields can perturb measurements in the laboratory, by adding significant noise to the measured signal.
How does this cage work? When do I need to use it? How do I set up my BioLogic potentiostat to make best use of a Faraday cage?
All of these questions, and more, will be answered in this Learning Center article. One of the most common examples of a Faraday cage is the door of a microwave with its metal screen with holes. The screen prevents the microwaves from getting out while allowing light, with its higher energy and shorter wavelength, to pass through.
A Faraday cage is basically a closed piece of metal, which can be either meshed or continuous. A key property of a Faraday cage is that the electric field is zero everywhere inside. Any external sources of the electrical field are screened out. This is illustrated in Figure 1.
Figure 1: Schematic representation of the use of a Faraday cage. The Faraday Cage screens out external interference coming
from devices located in the vicinity of the measurement. These devices are connected to the grid and the Faraday
cage is earthed, thereby ensuring a constant voltage $V_0$ at its outer surface.
In essence, a Faraday cage is needed when the Device Under Test is either a very small capacitance, a very large resistance, or a combination of both, for example, highly resistive coatings, current measurements at microelectrodes, noise measurements, etc. In such cases, the effect of external perturbation cannot be dismissed.
In this article, we will present the case of a DC current measurement on a 100 GΩ resistor and an Electrochemical Impedance Spectroscopy measurement on a 6 pF capacitor in parallel with a 10 GΩ resistor. The objective of the DC measurement is to measure a very small current. For the AC measurement, the objective is to accurately determine the values of the resistance and the capacitance.
Current measurement on a 100 GΩ resistor
Using EC-Lab® and the Chronoamperometry technique, we recorded the current response of a 100 GΩ resistor to a potential step of 1 V (Figure 2) using an SP-300 with an Ultra-Low Current measurement head (ULC). Please note that the High-Speed Scan option is disabled, which is accessed in the “Safety/Adv. Settings tab” (Figure 3). The connection mode is a simple two-point connection mode, with P1/S1 on one side and P2/S2/S3 on the other side.

Figure 2: Chronoamperometry technique settings used to measure 10 pA on a 100 GΩ resistor.
This current range is available only for premium range (VMP-300) instruments. It should be
noted that a 50 kHz analog filter was used, and the first sequence with a duration of 5 s was added
prior to this sequence so that transients are removed.
Before this 10 s measurement, we added a sequence with the same parameters but running during 5 s, so that any transients are removed from our analysis. The acquisition time was set to 200 µs. The theoretical current which should be measured is 10 pA. The $I\,vs.\,t$ curve is plotted as well as the Discrete Fourier Transform (DFT) of the signal obtained via the Analysis tool in EC-Lab (Figure 4).
We performed one measurement outside of the Faraday cage and inside the Faraday cage.
For optimal use of the Faraday cage please ensure that:
- The Faraday cage is earthed for example via the earth (green) 4 mm receptacle at the back of the BioLogic instrument, close to the power switch. This can be checked by an ohmmeter.
- The Device Under Test (DUT) is placed in the center of the Faraday cage.
- Openings in the cage are minimized.

Figure 3: Safety/Adv. Settings and deactivated High-speed scan option
![]()
Figure 4: How to access the Fourier Transform analysis tool.
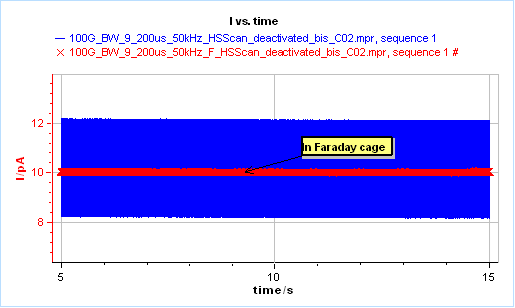
Figure 5a shows the $I\,vs.\,t$ obtained by applying a 1 V voltage step on a 100 GΩ resistor. The blue curve is the current obtained outside of the Faraday cage and the red curve inside of the Faraday curve. It can be seen that the external noise is greatly reduced.
The current measured inside the Faraday cage varies between 8.152 pA and 12.18 pA, and inside the Faraday cage between 10.01 and 10.06 pA.
Figure 5b shows the corresponding DFT of both time responses. The red curve was obtained in the Faraday cage and it can be seen that the 50 Hz interference from the grid was removed as well as all its harmonics (up to the 50th harmonic). Surprisingly, a 31.1 Hz interference is still present in both signals, which could arise from mechanical vibration.
5a

Figure 5: a) $I\,vs.\,t$ response of a 100 GΩ resistor submitted to a 1 V potential step,
in blue outside of the Faraday cage and in red inside the Faraday cage; b) corresponding
Fourier Transform.
Impedance measurement on a 6 pF capacitor in parallel with a 10 GΩ resistor
Potentio-controlled Electrochemical Impedance Spectroscopy measurements were performed on an R/C with nominal values of 10 GΩ and 6 pF for the resistor and the capacitor, respectively. The circuit was placed in the middle of the Faraday cage.
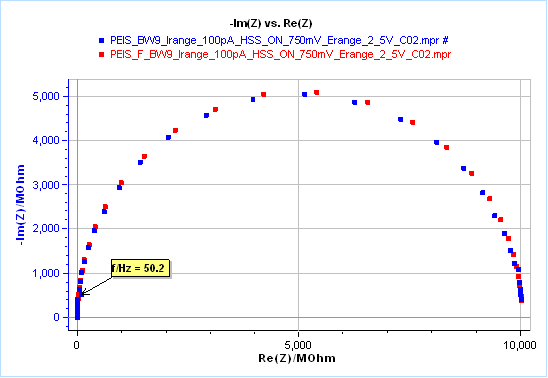
The parameters used are shown in Figure 6 and the results in Figure 7. In blue, we see the results of measurements performed outside the Faraday cage, in red the results of measurements performed inside the Faraday cage. In Figure 7a, we see that both diagrams seem very similar except for a noisy point at 50 Hz, due to the electromagnetic exterior interference, which does not appear when measurements are performed in the Faraday cage.

Figure 6: Parameters used for the PEIS measurement on the R/C circuit.
Note that the High-Speed Scan was activated, contrary to Figure 2.
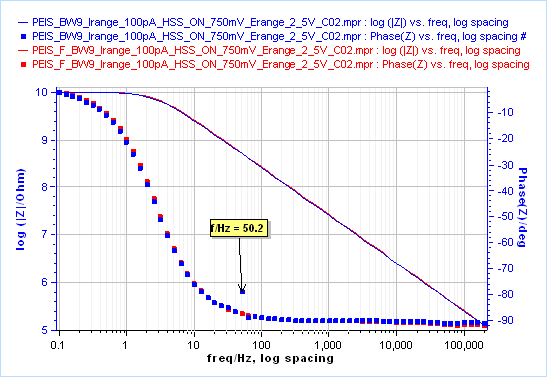
This perturbation is more visible on the Bode representation of the impedance, we can see a phase data point at 50 Hz that is slightly off (Figure 7a).
If we fit the data using an R/C circuit we obtain the parameters’ values shown in Table I. The improvement due to the Faraday cage does not seem to strongly affect the determination of the parameters. The lower value of the X²/|Z| in the case of the Faraday cage would tend to show better fitting results.
The benefits or, moreover, the effects of the Faraday cage can be seen in Figure 7c, which shows the Total Harmonic Distortion (THD) and the Noise-to-Signal Ratio (NSR) of the current response. You can find more information on these parameters in the following application notes and white paper.
Outside the Faraday cage, the influence of external perturbations can be seen as it creates harmonic signals for various fundamental frequencies: 31.7 kHz, 50 Hz, 25 Hz, 10 Hz (blue line). Also, the NSR is also quite important at almost all frequencies (blue points).
Using a Faraday cage removes ensures that the signal response is not perturbed by electromagnetic fields (Fig. 7c red line and red points).
a)
b)
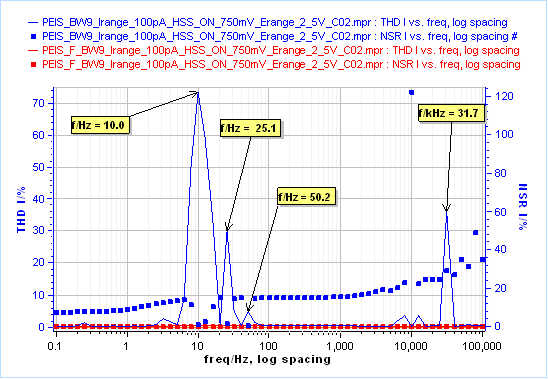
c)
Figure 7: PEIS measurements on an R/C circuit with nominal values of 10 GΩ and
6 pF for the resistor and the capacitor, respectively ; a) Nyquist diagram, b) Bode
diagram, c) THD and NSR ; blue) outside the Faraday cage, red) inside the
Faraday cage.
Table I: Comparison of the fitting performed on results shown in 7a (except the impedance data obtained close to the wall of the Faraday cage).

Finally, a last impedance measurement was performed by approaching the R/C to around 1 cm from the inner wall of the Faraday cage. By doing so, we let the capacitor formed between our circuit and the wall influence our results. The influence of this parasitic capacity can be seen in Table I: the value of the capacitance obtained by fit is around 10% lower than the value obtained in the center of the Faraday cage.
Faraday Cage: Key points to remember…
- Performing measurements on low capacitances (< 1 nF) and high resistances (> 10 kΩ) require the use of a Faraday cage to suppress the influence of external electromagnetic interferences, mainly coming from the grid at 50 or 60 Hz and emitted by instruments near the measurement area.
- It also requires Premium range instruments with an Ultra-Low-Current option (< 10 mA).
- You should check that the Faraday cage is properly earthed.
- The DUT must be placed in the center of the Faraday cage, otherwise, it is coupled with a parasitic capacitor between the DUT and the Faraday cage.
- No device powered by the grid should be placed inside the Faraday cage.
References
[1] https://en.wikipedia.org/wiki/Michael_Faraday
[2] https://en.wikipedia.org/wiki/Faraday_cage
[3] M. Faraday, Experimental Researches in Electricity, Vol. 1, reprinted from Philosophical Transactions of 1831–1838, Richard and John Edward Taylor, London, (1839) (paragraph 1174, p. 366); available online from https://www.gutenberg.org/ebooks/14986.
Further reading
BioLogic Application Note 5 – Precautions for good impedance measurements
S. J. Chapman, D. P. Hewett, L. N. Trefehen – Mathematics of the Faraday cage
BioLogic topic Potentiostats: Obtaining high quality measurements
[a] In 1836, when Faraday discovered the effect, he was then using a twelve-foot mesh cube [2], but the absence of field within a continuous metal shell had been noted by Benjamin Franklin as early as 1755 [3].


