

Battery science: Interactive glossary of terms
Latest updated: November 15, 2024A comprehensive list of terms commonly used in battery science.
Please click on the term of interest in the table to see its definition. You can click on the yellow arrow in the bottom left-hand corner of the screen to guide you back to the menu in one click (please note that this page has been optimized for Google Chrome and may not work as effectively in other browsers).
Battery
An assembly of two or more cells electrically connected to form a unit. For example, a 12 V SLI battery is made up of six 2 V cells in series. However, the term is also often used to indicate a single cell.
Battery cell
An assembly of at least one positive electrode, one negative electrode, and other necessary electrochemical and structural components. A cell is a self-contained energy conversion device whose function is to deliver electrical energy to an external circuit via a controlled internal chemical process. This chemical-to-electrical energy conversion process involves ionic transport between electrodes having different potentials.

For more information on three-electrode battery measurements please see the following article: “Not Negative. Not Positive. Negative AND Positive. Full Cell Control for Premium & Essential Instruments“.
Primary cell
A primary cell is a cell, which delivers electrical energy using an electrochemical process that is not reversible. Example: alkaline cell, Leclanché cell.
Secondary cell
A secondary cell is a cell, which delivers electrical energy using an electrochemical process that is reversible. This means that the chemical energy converted into electrical electricity can be restored by applying a current in the opposite direction as the one flowing during the battery use.
The current flowing during battery use is named discharge current and the current flowing to restore the chemical energy is called charge current. Secondary cells have the ability to store chemical energy when it is not in use.
Examples: Li-ion batteries, Ni-MH batteries, redox flow batteries, and so on.
Battery module
A battery module is the smallest grouping of physically and electrically connected cells that can be replaced as a unit. A module can be thought of as the smallest, repeating building block of a battery pack.
Battery pack
An array of interconnected modules that have been configured for an intended energy storage application, (the configuration is application dependent).


BMS (Battery Management System)
A BMS is an electronic device that is used to protect the elements of a battery pack and to indicate the remaining capacity or charge of each element.
It usually monitors:
- The voltage of the pack and each individual cell
- The current
- The temperature of each cell, as well as the temperature of the input and/or output cooling fluid.
- The cooling fluid flow rate.
Various variables are computed using these monitored values: SoC, SoH, energy, charge, and so on… See State of Charge, SoC, and State of Health, SoH, for the definitions of these magnitudes.
Battery model and geometry
For coin cells and cylindrical batteries, the associated code refers to the geometry of the battery. It is generally under the form: XXYYZ.
- X: the diameter of the battery in mm
- Y: the height or thickness of the battery in mm, with Z the first decimal.
Below is an example of the ANR26650M1-B cell by A123 systems, which is a 26650 battery. The CR2032 coin cell has a diameter of 20 mm and a thickness of 3.2 mm.


Calendar aging
Calendar aging is the irreversible proportion of capacity lost during storage. In other terms, it is the degradation caused by battery storage.
Capacity, SI unit : C (A·s)
Rated capacity Cr, SI unit : C (A·s)
The rated or nominal capacity $C_r$ of a battery is the total amount of charge obtainable from a practical cell as defined by the manufacturer of the cell under certain conditions.
The capacity is given in A h or mA h for a given value of the discharge current expressed as a C-rate.
For example for the ANR26650M1-B by A123 systems:
![]()
These values are obtained for a rate of 0.5 C. See C-rate
Capacity slippage
Capacity slippage refers to the fact that during charge/discharge, irreversible reactions occur in a battery, which prevents it from fully recovering the discharge capacity during charge or from fully discharging the capacity accumulated during charge.
The figure on the left below shows the evolution of the potential as a function of time during charge, discharge, and recharge. The figure on the right shows the evolution of the voltage as a function of the cumulative capacity.

After a first charge, with a given charge endpoint (or cut-off voltage), the discharge endpoint is reached within a time that is smaller than the duration of the charge. The first discharge capacity (red curve) is smaller (in absolute value) than the first charge capacity (black curve). The blue double arrow shows what is called the discharge endpoint slippage ∆d. The red double arrow shows what is called the charge endpoint slippage ∆c.
The capacity fade cf for this 1.5 cycle is:
$$\text{cf} = \Delta_\text{d} − \Delta_\text{c}$$
(Electric) charge $Q$, SI unit: C (A·s)
The electric charge represents the quantity of electrons passing through an electric conductor. 1 C corresponds to a current of 1 A passing through a conductor during 1 s.
1 C = 1 A·s
1 C is exactly 1/(1.602176634×10−19) elementary charges. The electric charge is often expressed as A·h or mA·h.
1 A·h = 3600 C
1 mA·h = 3.6 C
The practical formula to calculate the charge is:
$$Q=\int_0^T I(t)\text{d}t$$
Where $T$ is the duration of the experiment, ($t$) the current at the instant $t$. If I($t$) is constant for $t$ ∈ [0, $T$] and equal to $I$ then
$$Q = IT$$
During battery charging, $I$ is positive and the corresponding charge is often written $Q_\text{ch}$.
During battery discharging, $I$ is negative and the corresponding charge is often written $Q_\text{dis}$.
The scheme below shows the time evolution of the potentials of the positive and the negative electrode and of the cell voltage during discharge and charge.

Initial Charge $Q_\text{o}$, SI unit: C (A·s)
$Q_\text{o}$ represents the initial charge of a battery, before any other operation. For example, for storage and safety purposes, batteries are often delivered or sold with an initial charge, which is half of the rated capacity, for example for a 2 A·h battery, $Q_\text{o}$ would be 1 A·h.
Maximum charge $Q_\text{max}$, SI unit: C (A·s)
The maximum quantity of electricity that can be stored in a battery cell at any point in the battery life, as measured by a user usually by totally discharging or charging a battery at an initial State of Charge of 100 or 0%, respectively.
Specific conditions of C/rate, temperature, and voltage cut-off limits should be used and will influence the $Q_\text{max}$ value. When the battery is new, $Q_\text{max}$ is equal to the rated capacity ${C_\text r}$. See Rated capacity Cr, SI unit : C (A·s)
$Q_\text{max}$ differs from ${C_\text r}$ because the total charge that can be delivered by the battery will decrease over time and use of the battery, due to irreversible reactions taking place at the interfaces as well degradations of the battery materials. On this topic see Capacity slippage, Coulombic efficiency $\text{CE}$.
Charge profile
The schedule used for charging a battery cell. For example:
Constant current (CC or CI)
Charging of a battery at a controlled, constant rate of electron flow, normally applied with a voltage limit, also called Cut-off voltage, as is shown below
![]()
Constant voltage (CV)
Charging of a battery by applying a constant voltage while allowing the current to vary (normally applied with a current limit). Also called Floating charge.
CC-CV
A constant current charge is followed by a constant-voltage charge.
As said above, the constant current is given with a voltage cut-off limit and the constant voltage with a current or a time limit, as is shown below
![]()
For more information on why this protocol is the most commonly used, you can read the following article: “How to avoid side reactions during battery charging/discharging?”.
Coulombic efficiency $\text{CE}$
For secondary cells, the Coulombic Efficiency $\text{CE}_n$ represents the ratio of charge released during the discharge (${Q_\text{dis}}_n$) to the charge necessary for charging the battery (${Q_\text{ch}}_n$) at a given charge/discharge cycle $n$.
$$\text{CE}_n = \left| \frac{Q_{\text{dis}_n}}{Q_{\text{ch}_n}} \right|$$
It is sometimes expressed as ppm: $\text{CE}_n/\text{ppm} =\frac{\text{CE}_n}{1000000}$
For more information on the use of coulombic efficiency, see the following article: “HPC: The importance of ultra-precision battery cyclers” and “Resolution, Precision, Accuracy, Temperature stability and Time base: The five to watch (Electrochemistry Basics Series)”.
C-rate
The C-rate corresponds to a charge or discharge current.
A cell discharging at a rate of $N$C will deliver its nominal rated capacity $C$ in 1/$N$ h.
If the rated capacity is 2.5 A h, a C-rate of 0.5 C or C/2 means that 2 h will be needed to fully discharge the battery at a current of 1.25 A; a rate of 3C corresponds to a current of 7.5 A and so on.
Cyclability
Cyclability is the ability of a secondary battery to sustain its initial capacity overcharge/discharge cycles. The cyclability is estimated by plotting the coulombic efficiency as a function of cycle numbers.
Cycle
The period commencing from the start of one charge/discharge to the start of the next charge/discharge where said period includes discharge time, open-circuit time, and charge time. The depth of discharge (or percentage of capacity) associated with each cycle must be specified. In green a discharge/charge cycle and in pink a charge/discharge cycle with potential limits at 4.2 V and 3 V, for the charge and discharge, respectively.
Cycle life
The number of cycles, each to specified discharge and charge termination criteria, such as depth-of-discharge, under a specified charge and discharge regime, that a battery can undergo before failing to meet its specified End-Of-Life criteria.
Cyclic Voltammetry
Cyclic Voltammetry (CV, not to be confused with Constant Voltage) consists of repeatedly sweeping the electrode potential $E_\text{WE}$ with time between two potential limits, called vertices or vertex potentials $E_\text{1}$ and $E_\text{2}$ and recording (and plotting) the $I$ − $E$ curve directly.
The initial and final potential values $E_\text{i}$ and $E_\text{f}$ are usually different from the two vertices.
Usually, the potential is varied linearly with time (i.e. the applied signal is a voltage ramp) with sweep rates $\upsilon$ ranging from 10 mV/s to about 1000 V/s. For a battery, usually scan rates as low as 0.1 mV/S can be used. Cyclic Voltammetry can be useful to separately study the electrode reactions, but a third electrode is needed.
For more information on how to interpret CV curves please see the following article: “How to read battery cycling curves”.
Depth of Discharge, DoD
The DoD is the percentage of capacity at which a cell or battery has been discharged. It is equivalent to the SoC.
DoD = 100 – SoC
For more details, see State of Charge, SoC.
For further information on SoC, please the following article: “Battery State of charge (SoC), State of Health (SoH)”.
Device Under Test
The DUT generally refers to the device under test. It does not refer to anything specific as it can be a battery cell, a battery pack, a battery module, a piece of metal etc.
Differential (incremental) capacity, $\text dQ$⁄$\text dE$, SI unit: A·h·V-1
The differential capacity consists in calculating the derivative of the capacity with respect to the potential. This calculation and the corresponding representation can be derived from any charge or discharge curve, performed in a galvanostatic mode or in a potentiostatic mode. The potential plateau in a charge or discharge curve appears as a peak on a differential capacity curve, as can be seen in the figure below:

Depending on the type of sampling conditions, various procedures are available to plot this curve, which are explained in more detail in the following BioLogic application notes:
Application Note 40: Differential (Incremental) Capacity Analysis
Application Note 57: Differential Coulometry Spectroscopy (DCS)
Discharge curve
The discharge curve is a common characteristic curve of the battery, which shows the evolution of one of the electrode potentials ($E$) or the cell voltage ($U$) as a function of the charge $Q$ or the SoC or the DoD or time $t$.
The graph below shows the evolution of the positive electrode potential of a battery cell during discharge at a constant current.
$E_\text{th}$ represents the thermodynamic positive electrode potential when the cell is fully charged. The curve was simulated assuming linear restricted insertion of the charged species.
One can see a potential plateau, that can be used to define the nominal potential, or if measured on a battery cell terminals, the nominal voltage (green dashed line).

Duty cycle, $D$
In electronics
In electronics, referring to a square wave signal, it is the ratio of the pulse duration or pulse width $PW$ in s over the period of the signal $T$ in s.
$$D=\frac{PW}{T}$$
In battery testing
In the world of batteries, by extension, it refers to the pattern of current usage of a battery, needed to calculate the total charge drain from a battery.
For example, for a battery used for one hour in portable telecom devices, a typical duty cycle is the following:
| Standby Mode | Receive Mode | Transmit mode | |
| Time percent/% | 80 | 10 | 10 |
| Current drain/mA | 10 | 6 | 325 |
| Charge drain/mA h | 8 | 6.2 | 32.5 |
The hourly capacity loss is 8 + 6.2 + 32.5 = 46.7 mA·h.
Again, taking the example of the ANR26650M1-B cell by A123 systems, which has a minimum rated capacity of 2400 mA h, it could reach 20% of its capacity in $\frac{(1-0.2)2400}{46.7}\approx41\,\text{h}$
Electric current $I$, SI unit: A
The electric current is a stream of electrons passing through an electrical conductor or space. 1 A corresponds to a charge quantity of one coulomb going past a given point per second.
In electrochemistry, following IUPAC, the current is positive when an oxidation reaction occurs on the electrode under study. It is negative when a reduction reaction occurs on the electrode under study.
See (Electric) charge $Q$, SI unit: C (A·s)
EIS (Electrochemical Impedance Spectroscopy)
The EIS technique consists of studying the response of an electrochemical system submitted to a sinusoidal electrical perturbation at various frequencies.

If the system is linear and time-invariant, the input and the output signals are sinuses with the same frequency. They have different amplitudes $\delta E$ and $\delta i$. They are phase-shifted of a constant value $\psi$.
Using the complex notation:
$$Z=\delta E/\delta I\cos \phi+j\,\delta E/\delta I\sin \phi$$
$$|Z|=\left|\frac{\delta E}{\delta I}\right|=\sqrt{(\text{Re}\,Z)^2+(\text{Im}\,Z)^2}$$
$$\phi=\arctan\left(\frac{\text{Im}\,Z}{\text{Re}\,Z}\right)$$
$Z$ is the complex impedance of the system.

For more information on how to use Electrochemical Impedance Spectroscopy to characterize battery cells please see the following resources:
- Learning Center Article “Why use Electrochemical Impedance Spectroscopy (EIS) for battery research?“
- Learning Center Article “How to make reliable Electrochemical Impedance Spectroscopy (EIS) measurements with your potentiostat or battery cycler”
- Learning Center Article “How to check and correct the time variance of your system under EIS measurements”
- Application Note 23 “EIS measurements on Li-ion batteries EC-Lab ® software parameters adjustment”
- Application Note 61 “How to interpret lower frequencies impedance in batteries”
- Application Note 62 “How to measure the ohmic resistance of a battery using EIS”
- White paper “Studying batteries with Electrochemical Impedance Spectroscopy”
Electrode
Electrode potential $E$, SI unit : V
What is usually designated by “electrode potential” is actually the potential difference between both sides of the electrode interface.
This potential difference (or voltage) can only be measured using a reference potential difference (or voltage).
The electrode potential is always defined relatively to a reference potential, for example E vs. Li (Li meaning the potential of metallic Li).Usually the reference electrode potential does not change, so if the electrode potential changes, it is due to modifications of the electrode.
Positive electrode
See also Battery cell
The positive electrode of a cell is the electrode with a higher potential. For a secondary cell:
During battery discharge, the positive electrode sees its potential (+) decrease because a reduction reaction is occurring at its interface with the electrolyte. It behaves as a cathode.
During battery charge, the positive electrode sees its potential (+) increase because an oxidation reaction is occurring at its interface with the electrolyte. It behaves as an anode.
For a primary cell, the positive electrode can be named a cathode.
| Type of battery | Typical materials |
| Li-ion | LiCoO2 (LCO), LiMn2O4 (LMO), LiNixMnyCozO2 (NMC), LiFePO4 (LFP) |
| Ni-MH | Ni(OH)2 |
| Ni-Cd | NiO(OH) |
| Lead-acid battery | PbSO4 |
The term “positrode” has also been suggested, which is a contraction of “positive” and “electrode”.
(Chen GZ, On combined capacitive and Nernstian mechanisms for improved electrochemical energy storage, Symp. 5: Novel Insights to Electrochemical Capacitors, 66th Annual Meeting of the International Society of Electrochemistry, Taipei, Taiwan, 4-9 Oct 2015.)
Negative electrode
See also Battery cell
The negative electrode of a cell is the electrode with the lower potential. For a secondary cell:
During battery discharge, the negative electrode sees its potential (−) increase because an oxidation reaction is occurring at its interface with the electrolyte. It behaves as an anode.
During battery charge, the negative electrode sees its potential (−) decrease because a reduction reaction is occurring at its interface with the electrolyte. It behaves as a cathode.
For a primary cell, the negative electrode can be named an anode.
| Type of battery | Typical mater als |
| Li-ion | LiC6, Li |
| Ni-MH | Intermetallic compounds: AB5 with A: rare-earth mixture of lanthanum, cerium, neodymium, praseodymium, and B: nickel, cobalt, manganese, or aluminium. |
| Ni-Cd | AB2 with A: titanium or vanadium, and B: zirconium or nickel, modified with chromium, cobalt, iron, or manganese. Cd |
| Lead-acid battery | PbSO4 |
The term “negatrode” has also been suggested, which is a contraction of “negative” and “electrode”.
(Chen GZ, On combined capacitive and Nernstian mechanisms for improved electro- chemical energy storage, Symp. 5: Novel Insights to Electrochemical Capacitors, 66th Annual Meeting of the International Society of Electrochemistry, Taipei, Taiwan, 4-9 Oct 2015.)
For more information on the difference between positive, negative electrodes, cathodes and anodes, please see the following Learning Center article: “What is the difference between positive and negative electrodes, anode and cathode: battery basics”
Electromotive force $\text{emf}$, SI unit: V
The electromotive force, $\text{emf}$ in V, of a battery is the difference between the potentials of the positive and the negative electrodes, when the battery is not under operation.
$$\text{emf}=E_{I=0}^{(+)}-E_{I=0}^{(-)}$$
Electrolyte
An electrolyte is a medium containing ionic species that carry the current when a potential difference is applied. The medium can be liquid or solid.
In a liquid phase, generally, the electrolyte is composed of a solvent and a solute. The solute consists of the electroactive species and the supporting salt, which is not electroactive and provides conductivity.
Solid state-electrolytes are generally oxides, sulfides, phosphates or polymers.
End-Of-Life (EOL)
The stage at which the battery meets specific failure criteria (e.g., capacity and/or power degradation). Specifically, when either:
the net delivered capacity of a cell, module, or battery is less than 80% of its rated capacity when measured on the RPT (Reference Performance Test);
or the peak power capability (determined using the Peak Power Test) is less than 80% of the rated power at 80% DOD.
Energy or energy capacity $W$, SI unit: J
The energy capacity is the total energy (work) obtainable from a practical cell upon discharge for a specific set of operating conditions including temperature, rate, age, stand time, and discharge cutoff criteria (specified by the battery manufacturer).
The energy capacity is the product of the charge and the voltage $U$, here considered constant:
$$W=UQ=U\int_0^T I(t)\text{d}t$$
Where $T$ is the duration of the experiment, ($t$) the current at the instant $t$.
If both the voltage and current are variable then:
$$W=\int_0^T U(t)I(t)\text{d}t$$
Where $T$ is the duration of the experiment, $U(t)$ and $I(t)$the current and the potential, respectively, at the instant $t$.
We can then define $W_\text{ch}$ the work or energy required to charge a secondary cell and $W_\text{dis}$ the work or energy released upon discharge.
Another unit that is being commonly used is W h or kW h.
1 W h = 3600 J
1 kW h = 3.6 × 10⁶ J
(Practical) Specific energy $w$, SI unit: J kg-1
The (practical) specific energy is the total electrical energy ($W$) obtainable from a practical cell in one discharge cycle divided by the mass of the respective cell ($m_\text{b}$). This quantity is often incorrectly called (practical) energy density. The specific energy is frequently given in W h kg-1.
$$w=\frac{W}{m_\text{b}}$$
Faraday constant $F$, SI unit: C mol-1
The Faraday constant represents the charge of 1 mol of electrons, that is to say the charge corresponding to the Avogadro’s number of electrons (6.02214076 × 10²³ electrons).
It is equal to: 96485.33212… C mol−1, often approximated to 96500 C mol-1.
GITT
GITT stands for Galvanostatic Intermittent Titration Technique. It is a technique based on a succession of current pulses, either positive or negative during a certain time, followed by a relaxation time at 0 current for a certain duration or until a certain potential. The figure below shows an example of a charge pattern.

This pattern or duty cycle is repeated until a certain voltage is reached. In the figure below a succession of discharge current pulses and relaxations is performed until a potential lower than 3.5 V is reached after the relaxation.
The potential response at each step can be used to derive under certain assumptions the diffusion coefficient of the inserted species into the intercalation material.

For further information on GITT, please see the following application notes:
- Application Note 1: “Protocols for studying intercalation electrodes materials- I: Galvanostatic cycling/potential limitations (GCPL) GITT”
- Application Note 70: “Determination of the diffusion coefficient of an inserted species in a host electrode with EIS, PITT and GITT techniques”
(Ultra) High Precision Coulometry ((U)HPC)
A technique consisting of measuring the current with high accuracy (and not precision) in order to accurately measure the coulombic efficiency over a very small number of charge/discharge cycles.
Measuring the coulombic efficiency with a high accuracy supposedly allows the user to accurately extrapolate the coulombic efficiency over a large number of cycles, which effectively represents a significant gain in time.
For more information please see the following Learning Center articles: “HPC: The importance of ultra-precision battery cyclers” and “Resolution, Precision, Accuracy, Temperature stability and Time base: The five to watch (Electrochemistry Basics Series)”
Hybrid Pulse Power Characterization (HPPC)
A Reference Performance Test (RPT) procedure used to determine the pulse power and energy capability under no-load conditions as a function of aging.
The first step of this test is to establish, as a function of capacity removed (a) the $V_\text{min}$ pulse discharge power capability at the end of a 30 s discharge current pulse and (b) the $V_\text{max}$ pulse regen power capability at the end of a 10 s regen current pulse.
These power and energy capabilities are then used to derive other performance characteristics such as Peak Power and Available Energy for direct comparison with specified targets.

Text and figure are taken from https://inldigitallibrary.inl.gov/sites/sti/sti/6492291.pdf
Jon P. Christopherson, Battery Test Manual For Electric Vehicles, Idaho National Laboratory
PITT, PSCA
PITT stands for Potentiostatic Intermittent Titration Techniques. It is a technique based on a succession of potential pulses. either in the positive or negative direction during a certain time, or until the current response slowly returns to 0. The figure below shows an example for increasing potential steps. The PSCA technique (Potential Step ChronoAmperometry) consists of applying one single step.

In the graph shown below, each potential step is applied during a certain duration and not until the current has returned to 0. For each step, using correct assumptions, and in certain conditions, the diffusion coefficient of the inserted species can be calculated. Please refer to the corresponding BioLogic documentation for further details on the subject.

For further information on PITT, please see the following application notes:
- Application Note 2: “Protocols for intercalation electrodes materials-2, Potentiodynamic Cycling/Galvanostatic Acceleration (PCGA) PITT”
- Application Note 70: “Determination of the diffusion coefficient of an inserted species in a host electrode with EIS, PITT, and GITT techniques”
Power $P$, SI unit: W
The power is the rate per unit time at which energy is transferred to a cell or delivered by this cell. The power can be calculated from the energy $W$ transferred during a duration $T$:
$$P=\frac{W}{T}$$
The instantaneous power ($t$) can also be calculated from the instantaneous voltage and current:
$$P(t)=U(t)I(t)$$
Continuous power
Nominally, the power level required to remove 75 % of the rated energy from the battery in 1 h.
Peak power
The 30 s sustained pulse power obtainable from a battery under specified conditions.
Specific power $p$, SI unit: W kg-1
The specific power, often incorrectly called power density, is the capability to deliver power per mass of a primary or secondary battery $m_\text{b}$. The specific power of a cell depends on the discharge current and decreases during discharge.
$$p=\frac{P}{m_{\text{b}}}$$
Ragone plot
The plot of the specific energy and the continuous specific power at which the battery is discharged. It is originally defined as the set of curves ranging between the high-power design and the high-energy design for a particular technology.

Richter, Martin & Sarram, Amirhossein & Kaucher, Christian & Winkler, Herwig. (2019). Investigation and analysis of accumulators for the use of electrochemical storage in hybrid shunting locomotives. Procedia CIRP. 81. 1010-1015. 10.1016/j.procir.2019.03.243.
Resistance, SI unit Ω
ACIR (AC Internal resistance)
ACIR is a method used to calculate the internal resistance based on an impedance measurement at a given frequency, generally 1 kHz. Here again, depending on the procedure and the norm different values are chosen for the ACIR.
In IEC 61960, the ACIR is the ratio of the RMS of the voltage and the RMS of the current.
$$R_{\text{AC}}=\frac{U_{\text{RMS}}}{ I_{\text{RMS}}}$$
Other definitions can be found:
$$R_{\text{AC}}=|Z|_{1\,\text{kHz}}$$
$$R_{\text{AC}}=\text{Re}\,Z_{1\,\text{kHz}}$$
DCIR (DC Internal Resistance)
DCIR is a method used to calculate the so-called internal resistance. It generally consists of applying two different current values at different times $t_1$ and $t_2$ and measuring the voltage responses. The potential variation divided by the current variation gives the internal resistance.
$$\text{DCIR}=\frac{U(t_2)-U(t_1)}{I_2-I_1}$$
The parameters depend on the procedure applied. For example in the international norm IEC 61960
$$I_1 = C/5, \; I_2 = C, \; t_1 = 10 s, \; t_2 = 11 s$$
Where $C$ is the C-rate of the considered battery cell.

Other methods exist for example the VDA method:

H.-G. Schweiger et al., Sensors 10 (2010) 5605.
The physical meaning of the internal resistance depends on the method used to calculate it. See Ohmic resistance, $R_\Omega$, SI unit Ω for other definitions.
Internal resistance, $R_\text{int}$, SI unit Ω
The internal resistance of a battery is a generic term that does not designate a specific resistance in the battery. It is usually measured by various DC current or potential steps methods and hence does not refer to the resistance of any particular component in the battery. It is a loose characteristic of the battery and can only be used to compare batteries if the determination procedure is the same.
It is very frequently confused with the ohmic resistance and is sometimes called apparent resistance $R_\text{app}$.
Ohmic resistance, $R_\Omega$, SI unit Ω
The ohmic resistance refers to the resistance associated with all the parts in a battery that have an ohmic behavior, i.e. a resistance that does not depend on the frequency, which is the definition of resistance.
The ohmic resistance is the sum of the resistance of the separator, the electrolyte, the current collectors, the connections, and possibly the passivation layers formed on the electrodes.
The only suitable way to measure the ohmic resistance is to perform an Electrochemical Impedance Spectroscopy measurement over a suitable frequency range and to fit the data with an equivalent circuit that contains a resistance in series.
The ohmic resistance is measured at higher frequencies.
The figure below shows various resistance values obtained using different methods:
- $R1$: this value was obtained by fitting the data using an equivalent circuit: R1 + R2/L2
- $R_{\Omega,\phi \approx 0}$: this value was obtained by taking the real part of the impedance of the point at or close to zero phase
- $|Z|_\text{min}$: this value was obtained by taking the real part of the impedance of the point with the lowest modulus
- $R_{\Omega, \text{min}}$: this value was obtained by taking the real part of the impedance of the point with the minimum real part

The table below shows the error for each value. The error is small because of the low value of the inductance.

Referring to the datasheet of ANR26650M1-B cell by A123 systems, the ohmic resistance is referred to as internal impedance and is measured by taking the value of impedance modulus at 1 kHz:
![]()
For more details please see application Note 62 “How to measure the ohmic resistance of a battery using EIS”
SEI (Solid Electrolyte Interphase)
The SEI is a nanometer-thick passivation layer that forms on the negative electrode of Li-ion batteries due to the decomposition of the electrolyte. This layer, which allows ion diffusion and blocks electron transfer, is responsible for the further stability of the battery. See the following paper for more details
Self-discharge, %/year
The process by which the available capacity of a battery is spontaneously reduced by undesirable chemical reactions or electronic short circuits within the cell.
Self-discharge occurs when the cell is disconnected. It is different from the capacity loss that occurs when the cell terminals are left connected to a device that is not under operation.
Self-discharge is defined as a percentage per month or per year and can be used to define the shelf life of the battery.
State of Charge, SoC
The SoC is defined as the ratio of the remaining charge in the battery divided by the maximum charge that can be delivered by the battery, expressed as a percentage:
$$\text{SoC}/\%=100\,(Q_0+Q/Q_{\text{max}})=\text{SoC}_0+100\,Q/Q_{\text{max}}$$
Q0 is the initial charge of the battery in A·h or mA·h, Q is the quantity of electricity delivered by or supplied to the battery in A·h or mA·h, Qmax is the maximum charge available of the battery in A·h or mA·h and SoC0 the initial SoC of the battery.
If the battery is new, $Q_{\text{max}}=C_{\text{r}}$ and $Q_0=0.5 Q_{\text{max}}$, generally.
If the battery is fully charged, $Q_0=Q_{\text{max}}$ and $\text{SoC}_0=100\%$.
Q follows the convention of the current: it is negative during discharge and positive during charge.
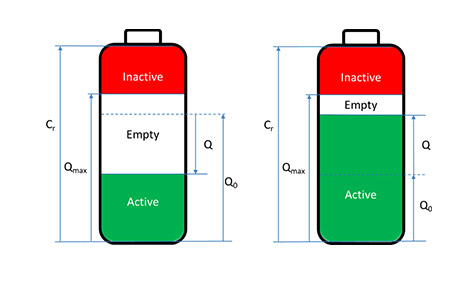
Illustration of the various variables used to define SoC (left) during discharge and (right) during charge.
Q is negative during discharge and positive during charge following the definition above.
For further information on SoC, please the following Learning Center article: “Battery State of charge (SoC), State of Health (SoH)”.
State of Health, SoH
SoH is defined as the ratio of the maximum capacity of a battery to the rated capacity, expressed as a percentage:
$$\text{SoH}/\%=100\,Q_{\text{max}}/C_{\text{r}}$$

Illustration of the various variables used to define SoH.
For further information on SoH, please see the following Learning Center article: “Battery State of charge (SoC), State of Health (SoH)”.
Thermal runaway
A process in which a cell undergoes an uncontrolled rise in temperature due to the passage of increasing current (on, say, short circuit discharge or constant voltage charging) as the temperature rises. The overheating can result in a violent explosion if the cell is sealed or not properly vented.
Trickle charge, SI unit: A
Low-rate charging current is applied to a battery to maintain a full charge and counter self-discharge.
Voltage $U$, SI unit: V
A voltage designates a potential difference. The potential difference between two potential differences is also named a voltage. A voltage change can be due to a change of any of the two electrode interfaces, this is why having a reference electrode in a battery cell allows to separately study one electrode. The voltage can be measured between the two terminals of a battery cell, a battery module, or a battery pack.
Cell voltage $U$ or $U_\text{cell}$, SI unit: V
The cell voltage $U$ or $U_\text{cell}$ in V, is the difference between the potentials of the positive and the negative electrodes when the battery is under operation.
Nominal cell voltage or Mid-Point Voltage (MPV), SI unit: V
It is the voltage indicated on the battery cell or the battery cell datasheet.
Definitions vary but it generally corresponds to the voltage of the battery that is measured when the battery has discharged 50% of its total energy, for a given discharge rate, 0.2 C for example.
The discharge rate is not always indicated, for example for the ANR26650M1-B by A123 systems:
![]()
Further reading.
Nomenclature, symbols, and definition in electrochemical engineering (IUPAC recommendations 1993) Pure & Appl. Chem.,Vol. 65, No. 5, 1993 p. 1009
USABC electric vehicle battery test procedures manual – Appendix F – Glossary of battery and battery testing terminology for the USABC battery test procedures
Modern batteries An introduction to electrochemical power sources – C.A. Vincent, B. Scrosati eds. – Butterworth-Heinemann 2d ed. 1997 – Glossary p. 333


