How to read battery cycling curves
Latest updated: February 14, 2024Introduction
A variety of experimental techniques can be used with batteries in order to study electrochemical reactions and battery behaviors.
The most traditional and direct technique consists of recording the evolution of the voltage and charge during successive charge/discharge cycles, ideally by regularly increasing the current.
From this “cycling” protocol, we can extract a large number of key parameters for the characterization of an accumulator, such as capacity or coulombic efficiency. It is also possible to estimate their state of health by following polarization, hysteresis, and overvoltage phenomena. From the same data set, several representations of interest can be drawn providing complementary information.
The U/I vs. time curve makes it possible to clearly visualize the upper and lower voltage limits as well as the cycle time (Fig. 1). With this time curve, all the cycles are identifiable and the charging/discharging stages generally have a symmetrical aspect if the processes are reversible.
For an identical current, a discharge time shorter than the charge time indicates low coulombic efficiency. At the end of the battery life, there is a decrease in battery charging and discharging times. Likewise, sudden variations in potential can be observed in the event of the appearance of micro-short circuits or component failures.
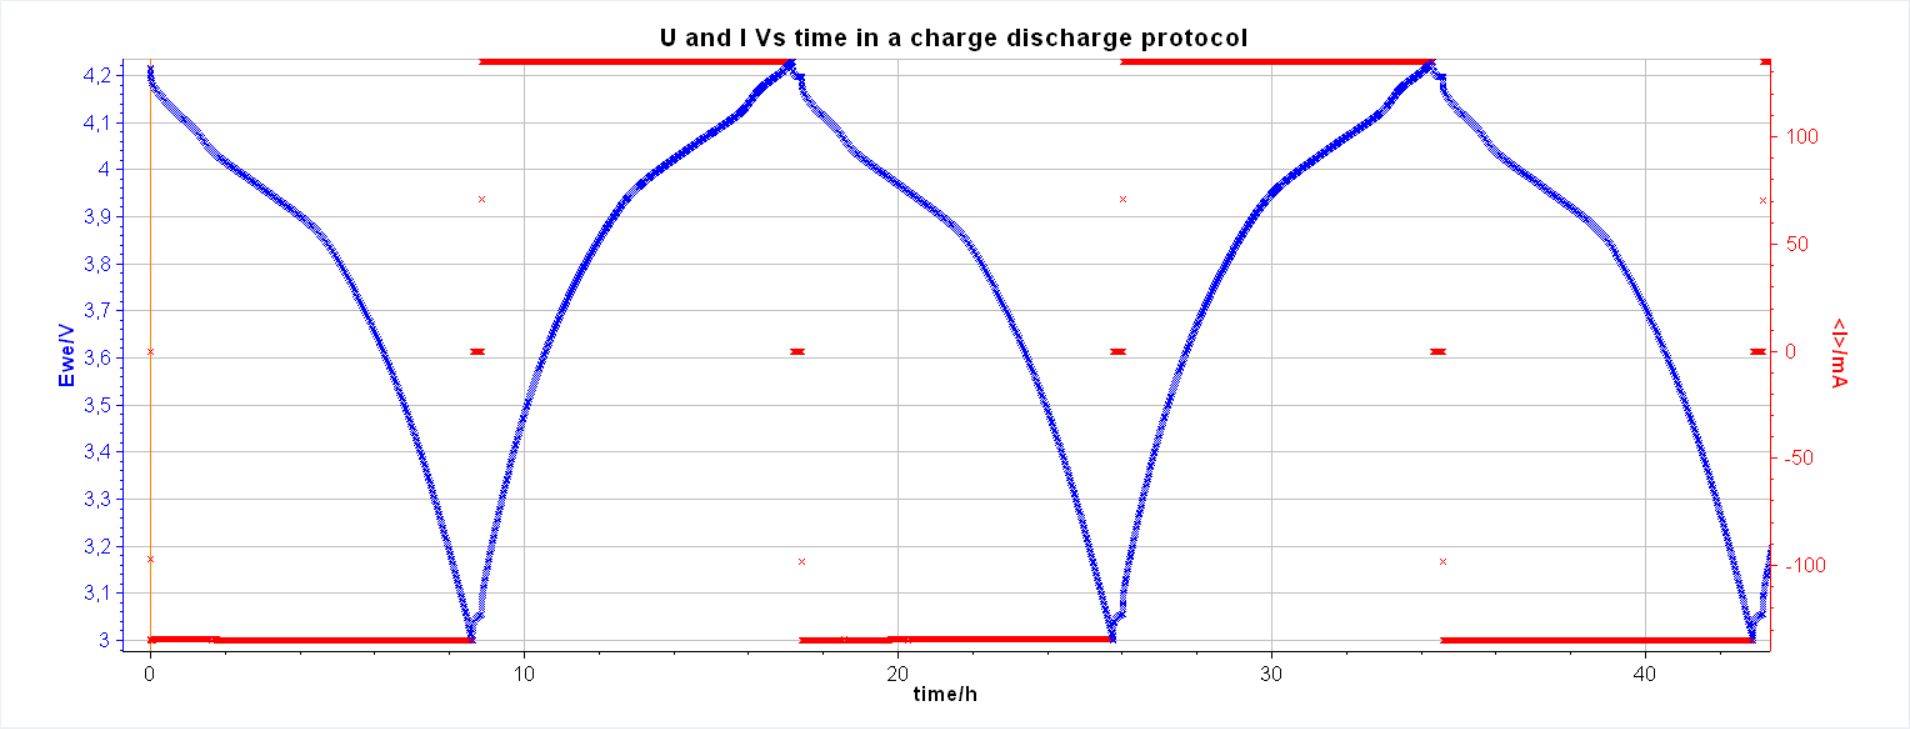
Fig. 1: A typical battery cycling time curve with the same C-rate.
At this point, we can either choose to study aging, using the representation of coulombic efficiency and capacity as a function of the cycles, or to isolate a particular cycle to study the insertion process in more detail.
Material Characterization
In order to observe electrochemical processes more closely, an E vs. Capacity representation, as shown in Fig. 2, of an isolated cycle, is frequently used as a good starting point.
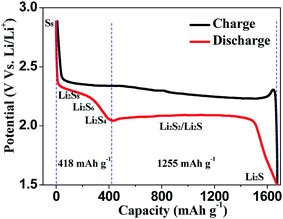
Figure 2: A typical individual charge/discharge cycle of a Lithium sulfur battery electrode in E vs. Capacity [1].
The E vs. Capacity curve makes it possible to identify the different phase changes involved in the charging and discharging processes as well as the associated capacities. This curve is complementary to differential capacity dQ/dE vs. E curve (Fig. 3). The advantage of the DC curve is that plateaus in the E vs. Q charge curve can appear as clearly identifiable peaks in the dQ/dE vs. E curve. These peaks are associated with electrode material phase transitions, if we consider a half-cell or a full cell with a third or the fourth electrode as a reference. The shape of the discharge and the charge curves give information about the reversibility of the electrode reaction. Plotting differential capacity dQ/dE (DCS/DCA) versus voltage allows the observation of any change (location, height, width, and area) in the peaks from one cycle to the next and can help detect degradation over long test cycles.
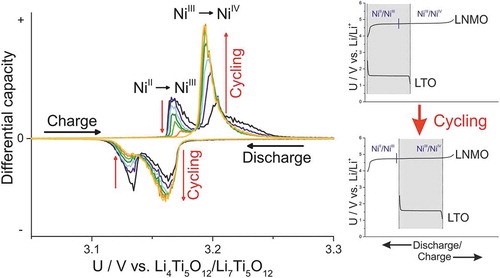
Figure 3 : Typical dQ/dE vs. E curve interpretation [2].
Another way of studying specific battery behavior is to plot voltage versus current or C-rate in order to obtain a polarization curve (Fig. 4). Since the output current plays such an important role in determining the losses inside a battery, it is an important parameter to consider when comparing battery performance. The terminal voltage of a battery, as also the charge delivered, can vary appreciably with changes in the C-rate. Furthermore, the amount of energy supplied, related to the area under the discharge curve, is also strongly C-rate dependent. When the cycling protocol contains cycles with increasing C-rates, it is possible to extract the potentials at different states of charge for each C-rate and reconstruct the polarization curve.
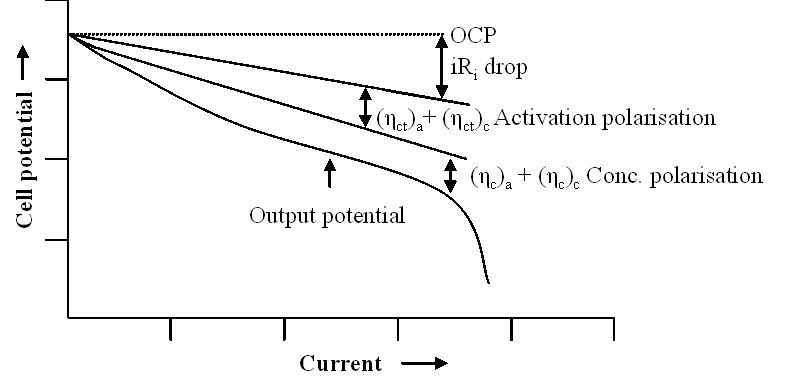
Fig. 4: A typical polarization curve of a battery with the contributions of several factors [3].
The voltage drop due to these factors can be mainly categorized as:
- IR drop – This drop in cell voltage is due to the current flowing across the internal resistance of the battery.
- Activation polarization – This term refers to the various retarding factors inherent to the kinetics of an electrochemical reaction, like the work function that ions must overcome at the junction between the electrodes and the electrolyte.
- Concentration polarization – This factor takes into account the resistance faced by the mass transfer (e.g. diffusion) process by which ions are transported across the electrolyte from one electrode to another.
Performance studies
Moving from theory to an application, the relevant physical properties of a battery may be different in different cases. Sometimes, specific energy and specific power (energy and power available per unit weight) are important, as in vehicle propulsion applications. The amount of energy stored per unit volume, called the energy density, can sometimes be more important. All those variables can be calculated during charge/discharge cycles.
However, an important parameter to consider is cycle life, which is the number of times a battery can be recharged before its capacity has faded beyond acceptable limits (typically a loss of ~20-30%).
The degradation of battery capacity with ageing, as encapsulated by the cycle life parameter, can be quantified by the Coulombic Efficiency (CE), defined as the fraction of the charge capacity available at a cycle n and the discharge capacity at a cycle n+1. This depends upon a number of factors, especially current and depth of discharge in each cycle. The temperature at which batteries are stored and operated also has a significant effect on the CE. A classical representation is the charge capacity (Qc) or the discharge capacity (Qd ) or CE vs. Cycle number at the same or a different C-rate (Fig. 4).
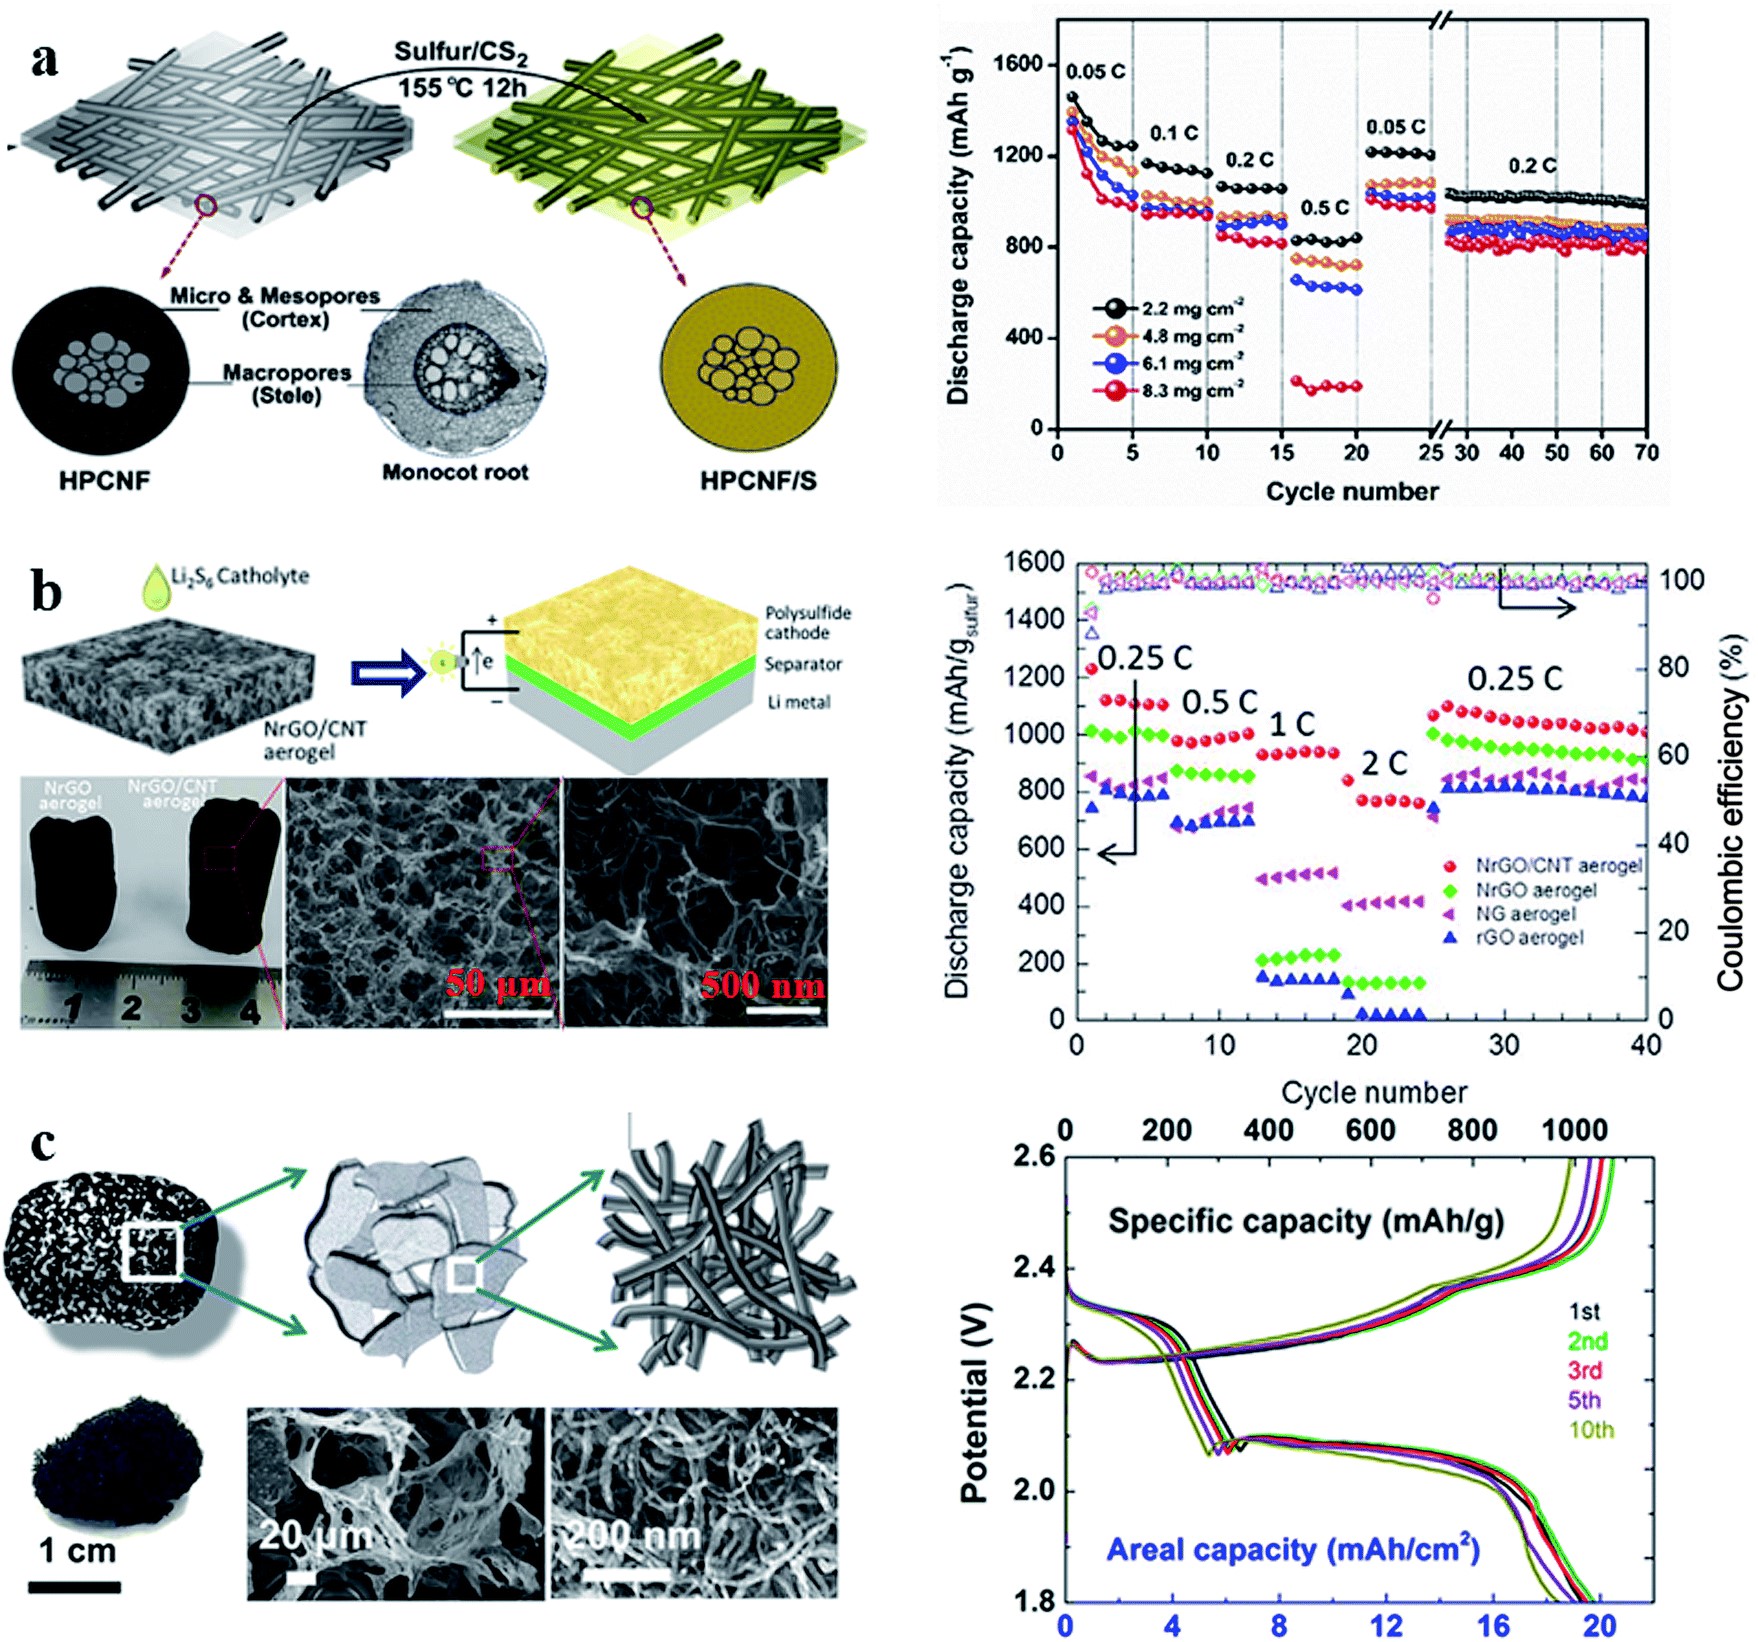
Fig. 5: Typical cycling experiments show the evolution of battery capacity and efficiency with cycling for different values of C-Rate [1].
Relatively simple cycling protocols containing only DC data are literally packed with vital information to help understand the electrochemical phenomena occurring over the life of a battery. Extracting and clearly representing all of these characteristic variables significantly optimizes the use of cycling data.
Indeed, the use of increasing C-rate, the use of short OCV periods at a different state of charge for the reconstitution of the polarization graph, or the use of pulses, considerably enrich the profitability of the cycling tests which are often long and resource-intensive.
In addition to classic cycling tests, the use of an urban profile scenario type also makes it possible to simulate the behavior of an accumulator with respect to a real consumption profile with partial charges and discharges, power peaks, and variable rest periods.
References
[1] Guo, J.; Liu, J. A Binder-Free Electrode Architecture Design for Lithium–Sulfur Batteries: A Review. Nanoscale Adv. 2019, 1 (6), 2104–2122. https://doi.org/10.1039/C9NA00040B.
[2] Philipp Jehnichen, K. W.; Korte, C. Degradation of High-Voltage Cathodes for Advanced Lithium-Ion Batteries – Differential Capacity Study on Differently Balanced Cells. Science and Technology of Advanced Materials 2019, 20 (1), 1–9. https://doi.org/10.1080/14686996.2018.1550625.
[3] Annual Conference of the Prognostics and Health Management Society, 2009 Modeling Li-Ion Battery Capacity Depletion in a Particle Filtering Framework Bhaskar Saha1 and Kai Goebel2.
Additional reading...
Related products