

SECM101: What is Constant Distance (CD)-SECM?
Latest updated: November 19, 2024The Constant distance (CD-SECM) technique: What, when and how it is used in scanning probe electrochemistry research.
This article introduces Constant Distance (CD)-SECM, which is the group of techniques used to follow sample topography during an SECM measurement.
What is Constant Distance (CD)-SECM?
When performing an SECM experiment there are two options for probe z position control during the measurement. Typically, experiments are performed in constant height mode, in which the probe position in z is maintained throughout the measurement. As the probe moves across the sample surface changes in sample topography result in changes to the probe to sample distance. Because the probe to sample distance influences the signal measured by SECM the resulting changes in the probe to sample distance cause changes in the measured signal. This is illustrated in Fig. 1. In constant distance mode, the probe position changes throughout the SECM scan to maintain the probe to sample distance allowing the probe to follow the sample topography throughout the measurement. When using constant distance mode, the signal measured by the SECM probe is only dependent on the sample activity. This is illustrated in Fig. 2. The term Constant Distance-SECM, or CD-SECM is used to cover the family of SECM techniques that follow sample topography throughout the experiment, including shear force SECM, soft stylus probe SECM, and Intermittent Contact (ic)-SECM.

Figure 1: Constant height SECM is illustrated for an insulating sample with varying topography.

Figure 2 : Constant distance SECM is illustrated for an insulating sample with varying topography.
What are the advantages of CD-SECM?
There are a number of advantages to using CD-SECM over the traditional constant height method. In SECM, particularly when used in the feedback mode, the signal measured can be strongly influenced by the sample topography. For samples with varying topography this can make data difficult to interpret, especially if information about the sample topography is not known from another microscopy technique. When the underlying sample topography changes are large, this can not only cause difficult data interpretation, but can also completely rule constant height SECM out, due to signal decay. In these cases, CD-SECM is the only way to measure the sample. Because the data measured by the family of CD-SECM techniques removes the topography effect from the measurement it is much easier for a user to interpret. While it is not true for all CD-SECM techniques, in many cases topography data is also measured in these experiments allowing for direct correlation of the topography data and the activity data to determine the effect of any topography features, for example edge effects. Because the sample topography is followed during a CD-SECM measurement probe crash is not a concern as is the case for a constant height SECM measurement. As a result, constant distance SECM measurements are often performed at smaller probe to sample distances than constant height SECM measurements, resulting in a stronger signal and contrast being measured.
When is CD-SECM used?
Without a constant distance option, the application of SECM is limited to samples whose surface topography is already well known and is relatively flat. By using CD-SECM instead the range of samples which can be measured is much broader. CD-SECM is often applied to samples with large changes in topography. This includes samples with noticeable surface roughness, and curvature. When such samples are measured using constant height SECM this underlying topography would outweigh the effects of sample activity on the resulting signal. CD-SECM is also particularly useful for measuring large scan areas. Over a large area it is often difficult to completely level the sample. When measured by constant height SECM the result is often a map for which tilt is readily apparent due to a decrease in signal strength and quality. Using CD-SECM instead avoids this issue by following the sample tilt throughout the measurement, ensuring the signal strength and quality remains consistent.
Intermittent Contact (ic)-SECM: An example CD-SECM technique
The Intermittent Contact (ic)-SECM is offered by BioLogic on the M470 to achieve constant distance SECM in both the ac- and dc-SECM modes. This is covered in full detail in the ic-SECM101: An Introduction to Intermittent Contact-Scanning Electrochemical Microscopy Learning Center article. ic-SECM maintains the probe to sample distance utilizing the vibration of the probe in z. In ic-SECM, the probe is vibrated in z perpendicular to the sample surface at a known vibration amplitude and frequency. As the probe comes into intermittent contact with the sample surface the vibration amplitude reduces compared to its amplitude in bulk. Because the system can accurately measure the vibration amplitude this reduction in vibration can be used to accurately track the surface. If the probe moves to an area of raised topography the vibration amplitude reduces further, causing the probe to retract until the setpoint amplitude is once again reached. On the other hand, if the probe moves to an area of lower topography the vibration amplitude increases causing the probe to move towards the surface until the vibration returns to its setpoint. Not only does this allow the probe to follow the sample topography, but it also allows the system to accurately measure the probe position resulting in both a topography and an activity map being measured through a single pass experiment. An example of the results possible using ic-SECM is shown in Fig. 3.
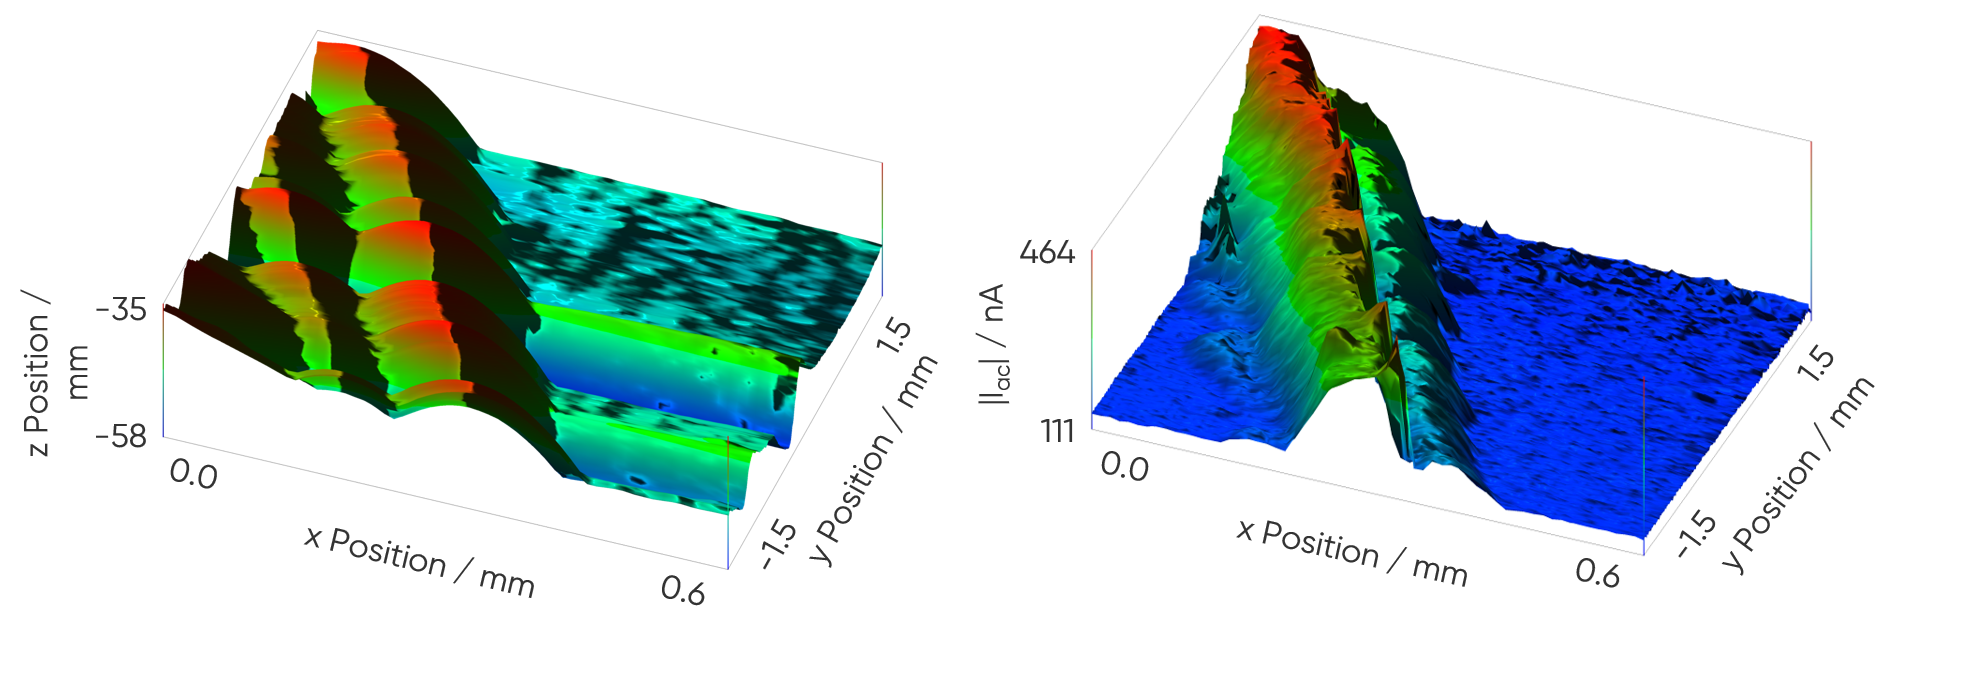
Figure 3 : ic-ac-SECM was used to measure an artificial scratch the inside coating of a drinks can in tap water.
An ac frequency of 100 kHz, ac bias of 100 mV, and dc bias of 0 V vs OCP were used.
The map on the left shows the sample topography, while the map on the right shows the ac current magnitude.


