

What is AC Voltammetry? Introduction to technique principles
Latest updated: October 8, 2024Introduction
Alternating Current Voltammetry (ACV) can be seen as a mix between Cyclic Voltammetry (CV) and Electrochemical Impedance Spectroscopy (EIS). This method is like CV because of the DC signal (a linear ramp between two vertices potentials) that is imposed on the cell, but ACV is also like to EIS because a sinusoidal signal of small amplitude is superimposed on this DC signal. The sinusoidal voltage is a single-frequency signal. Figure 1 is an illustration of the signal resulting from the addition of the AC signal to the DC level. The DC signal $E_{\text{dc}}(t)=E_\text{i}+\nu t$ is represented in purple. The AC signal $E_{\text{ac}}(t)=\delta E\, \text{sin}(\omega t)$ is represented in green. The resulting signal, represented in blue in Figure 1 is obtained by the following relationship:
$$ E(t)=E_\text{i}+\nu t+\delta E\, \text{sin}(\omega t)=E_{\text{dc}}(t)+E_{\text{ac}}(t) \tag{1}$$
Cyclic Voltammetry and Electrochemical Impedance spectroscopy are very common ways to study electrochemical systems. These techniques are described in detail in the articles What is a CV? A comprehensive guide to Cyclic Voltammetry and What is Electrochemical Impedance Spectroscopy (EIS)?.

Figure 1: Principle of AC Voltammetry. Purple: $\boldsymbol{E}_\mathbf{dc}\boldsymbol{(t)}$; Green: $ \boldsymbol{E}_\mathbf{ac}\boldsymbol{(t)}$; Blue: $\boldsymbol{E(t)}$
For example, Figure 2 represents an ACV experiment with a 10 Hz frequency and 10 mV amplitude signal. In this example, the DC signal is a voltage sweep from 0 V to 2 V and the AC signal is visible by zooming in.
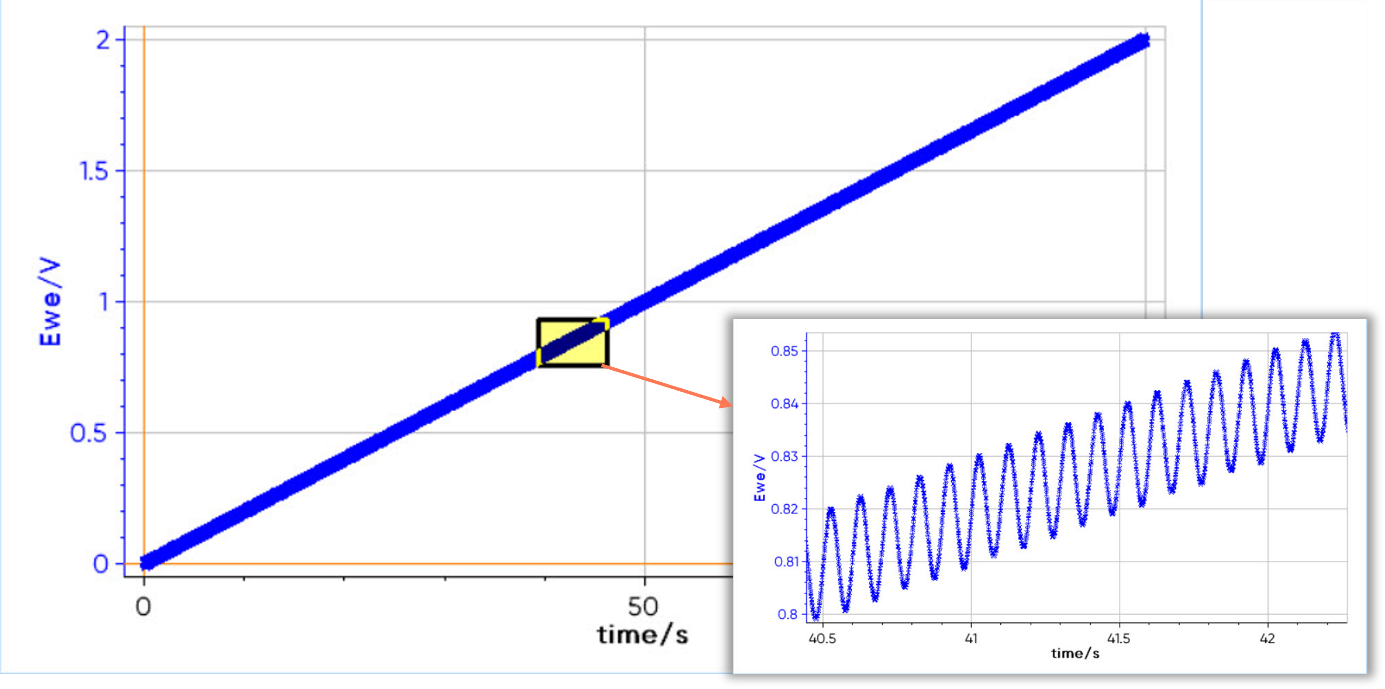
Figure 2: Voltage sweep of an ACV experiment with a frequency of 10 Hz and an amplitude of 10 mV.
ACV is used to obtain information about the electron transfer kinetics of the electrochemical reaction under study using the shape of the envelope of the AC signal.
Choosing the parameters

Figure 3: Settings window of ACV technique in EC-Lab® software
Vertices potentials
Choosing the vertex potential to run ACV measurements is no different than CV measurements. The potential sweep must be performed so that the electronic transfers and redox reactions of interest can be observed. The scan can be performed forward and backward to obtain information about the reversibility of reactions.
Frequency
The main difference between ACV and classical CV is that measurements can be performed at more than one frequency. The ACV is repeated every time the frequency is changed, giving the ability to probe electrochemical processes at different time scales. For example, electrochemical double-layer charging usually happens very fast (high frequencies), but the diffusion process is typically slower (low frequencies). During a classical CV experiment, both processes occur at the same time and contribute to the total current. Therefore, it can be difficult to separate the current response of these two processes.
With BioLogic’s potentiostat/galvanostat, an EIS-capable board is not required to perform ACV measurements.
One of the key parameters in such an electrochemical instrument is how fast it can change the control value (More details can be found here: Resolution, Precision, Accuracy, Temperature stability and Time base).
Amplitude
It is important to keep the amplitude of the AC signal small compared to the overall change in voltage occurring during the sweep. Typically, amplitude oscillations between 5 and 20 mV are used to perform reliable ACV measurements.
Analysis
With ACV it is possible to discriminate faradaic and non-faradaic (capacitive) current, and to focus on specific electrochemical phenomena by selecting an appropriate frequency for the input signal.
The analysis performed on ACV data is generally based on the separation of the AC and DC response, which can be done by several methods.
- Perform two separate experiments, one ACV and one CV. The DC response recorded by the CV experiment is subtracted from the ACV experiment file to access the AC envelope shape, allowing the ability to mathematically correlate waveform features with reaction parameters (surface area, diffusivity, concentration, activity coefficient, etc.).
- Average the AC voltammetry curves to filter out the AC component and determine the voltammogram.
- Work in the frequency domain rather than in the time domain by using Fourier transformation analysis. This gives access to the harmonics of the AC component, which are more sensitive to charge-transfer phenomena than DC voltammetry, i.e., the effects of the double-layer charging current are suppressed in the higher harmonics.
AC Voltammetry: A glossary of terms
| Term | Definition |
|---|---|
| AC Voltammetry | AC voltammetry (ACV) is an electrochemical analysis technique using sinusoidal voltage superimposed on a DC voltage signal. |
| Capacitive current | Current related to the charging and discharging of the capacitance created by the electrode | electrolyte interface. |
| Cyclic Voltammetry | Cyclic Voltammetry (CV) is an electrochemical analysis technique using a succession of DC voltage scans between 2 vertices to describe redox potentials. |
| Faradaic current | Current related to the electrochemical reaction occurring at the electrode | electrolyte interface. |
| Scan or Sweep rate | The rate at which the potential is scanned during an ACV. It can affect the reversibility of the reaction behavior and the steady-state conditions. |
| Vertex, vertices | Potential value or values between which the potential is scanned during linear scan Voltammetry (LSV) or CV. The scan rate sign is reversed at the vertices. |
Added in 04/2023


