

How to measure reaction kinetics parameters using Cycling Voltammetry (CV)
Latest updated: November 19, 2024Let us consider a simple redox reaction…
A + ze ↔ B (1)
…where A is the oxidizing species, B the reducing species, z the number of electrons, with B absent from the solution.
The effect of the potential scan rate on the shapes of the I vs. E curves is different whether the reaction is reversible or irreversible. Furthermore, different relationships exist between the peak potential, the reaction standard constant, and the other experimental parameters.
CV Sim is a powerful tool implemented in EC-Lab that allows the user to simulate I vs. E curves resulting from a voltammetry experiment. A vast array of parameters can be modified, making CV Sim a very accessible tool to understand what kind of information can be obtained by voltammetry on the studied electrochemical system.
The curves shown below were obtained using CV Sim for the reaction (1) written in the reduction direction.
For a reversible reaction, the peak potential Ep is constant and the peak current |Ip| increases with the scan rate (Fig. 1).
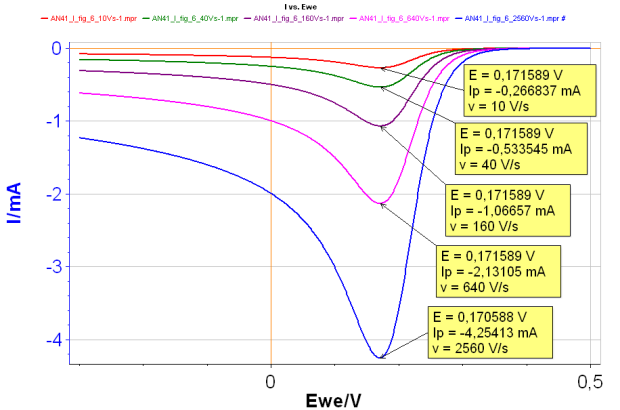
Figure 1: Change of I vs. E curve with increasing scan rates for a reversible reaction:
Red curve: 10 V s-1 ; Green curve: 40 V s-1;
Purple curve: 160 V s-1 ; Pink curve: 640 V s-1;
Blue curve: 2 560 V s-1 ; all with k° = 10 cm s-1
It is possible to determine the diffusion constant of the species A, by plotting the peak current as a function of the scan rate. The peak potential can be used to determine the standard potential of the reaction.
By increasing the scan rate, it is possible to turn a reversible reaction into an irreversible reaction. In this case, both Ip and Ep change when the scan rate changes (Fig. 2): the higher the scan rate, the higher |Ip| and the lower Ep.
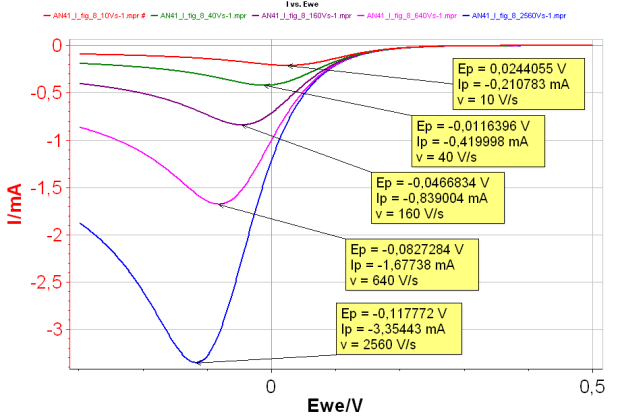
Figure 2: I vs. E with increasing scan rates for an irreversible reaction.
Red curve:10 V s-1;
Green curve: 40 V s-1;
Purple curve: 160 V s-1;
Pink curve: 640 V s-1;
Blue curve: 2 560 V s-1 with k°=0.001 cm s-1.
The slope of |Ip| vs. v1/2 curve (where v is the scan rate) can be used to determine the diffusion coefficient DA or the symmetry factor αr . Plotting Ep as a function of log(v) allows the determination of the reaction standard constant and the symmetry factor αr.
The presence of an ohmic drop as well as a double layer capacitance can also be simulated in CV Sim. More details can be found in the application notes 41-I and 41-II.
Related products
Le Lorem Ipsum est simplement du faux texte employé dans la composition et la mise en page avant impression. Le Lorem Ipsum est le faux texte standard de l'imprimerie depuis les années 1500, quand un imprimeur anonyme assembla ensemble des morceaux de texte pour réaliser un livre spécimen de polices de texte.


