

CV Sim: Simulation of simple redox reaction (E) Part 2 Ohmic drop effect & double layer capacitance Kinetics – Application Note 41-2
Latest updated: November 15, 2023Abstract
This second part of this application note is aimed at illustrating the effect of ohmic drop and double layer capacitance on the general shape of an I vs. E curve. As in the first part of the note, the simplest case is described (E mechanism and one species in solution).
The effects of the ohmic drop and of the double-layer capacitance on the shape of the I vs. E curve of a single electron redox reaction was studied using CV Sim. In the case where both an ohmic drop and a double layer capacitance are present, their values can be determined using the current response. All these aspects can be simulated by CV Sim, which makes CV Sim a very useful tool for teaching purposes.
Introduction
In part I of this series of application notes #40, we described how and which kinetic information could be deduced from the analysis of voltammetry curves obtained at various scan rates.
This second part of the series aims at illustrating the effect of ohmic drop and double layer capacitance on the general shape of an I vs. E curve.
The simplest case can be described as follows: a) the reaction is a simple redox reaction, b) only the oxidizing species is present in the solution, c) only a linear voltammetry is performed.
Background
The double layer capacitance
In a real electrochemical cell, the electrode-electrolyte surface behaves as a capacitance (Fig. 1). Consequently, the current response of an electrode undergoing a potential perturbation has two components: a Faradaic component, related to the actual electrochemical reaction and a capacitive component related to the discharge of the double layer capacitor. More information on the double layer capacitance is given in [1].
The total current I is:
$$I=I_c+I_f \tag{1}$$
where Ic is the capacitive current and If the Faradaic current.

Figure 1: A three-electrode setup with the illustration of the ohmic drop and the double layer capacitance.

The capacitive current Ic is :
$$I_c=C_{dl}\left(\frac{dE}{dt}\right)=-C_{dl}\nu \tag{2}$$
where Cdl is the double layer capacitance and v the constant scan rate. The minus sign represents the reduction reaction being studied, hence the scan is performed from the standard potential to more negative values.
Electrolyte resistance and the ohmic drop
The electrolyte resistance RΩ between the working electrode and the reference electrode can create an ohmic drop IRΩ (Fig. 1). The consequence of this ohmic drop is that the potential E(t) actually seen by the working electrode is different from the applied potential V (Fig. 1).
If we consider the scan rate v constant with the time t:
$$E\left(t\right)=E_{init}+\nu\ t-I(t)R_\Omega \tag{3}$$
with Einit the initial potential of the scan.
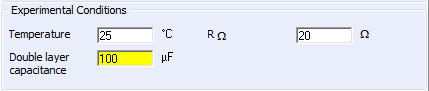
It is possible in CV Sim to account for the presence of the electrolyte resistance and the double layer capacitance in the setup window as shown in Fig. 2.

Figure 2: The choice of the ohmic drop and the double layer capacitance.
Effect of Cdl
The parameters are the following:
- k° = 1 cm.s-1
- Initial CA: 4.10-4cm-3 (4.10-1 mol.L-1) and initial CB: 0
- DA = DB = 10-6 cm2.s-1
- A = 0.03142 cm2 (linear semi-infinite electrode)
- Einit = E° + 0.3 V
- E1= -0.3 V
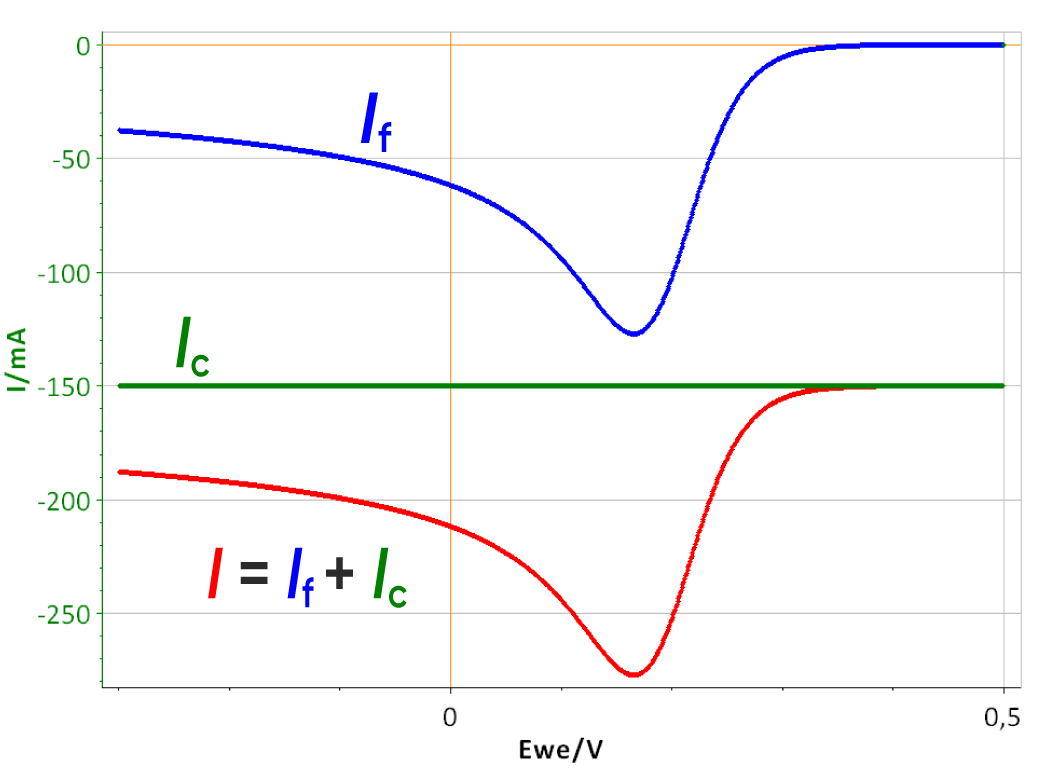
A “random” k° and a scan rate of 10 V/s were used. The effect of a 100 µF double layer capacitance can be seen on a I vs. E curve in Fig. 3a. (with RΩ = 0) The total current is shifted to a lower values.


Figure 3: a) I vs. E curve with and without a 100 µF double layer capacitance, scan rate of 10 V/s, b) Corresponding I vs. t curve Total current I, Faradaic current If and capacitive current Ic.

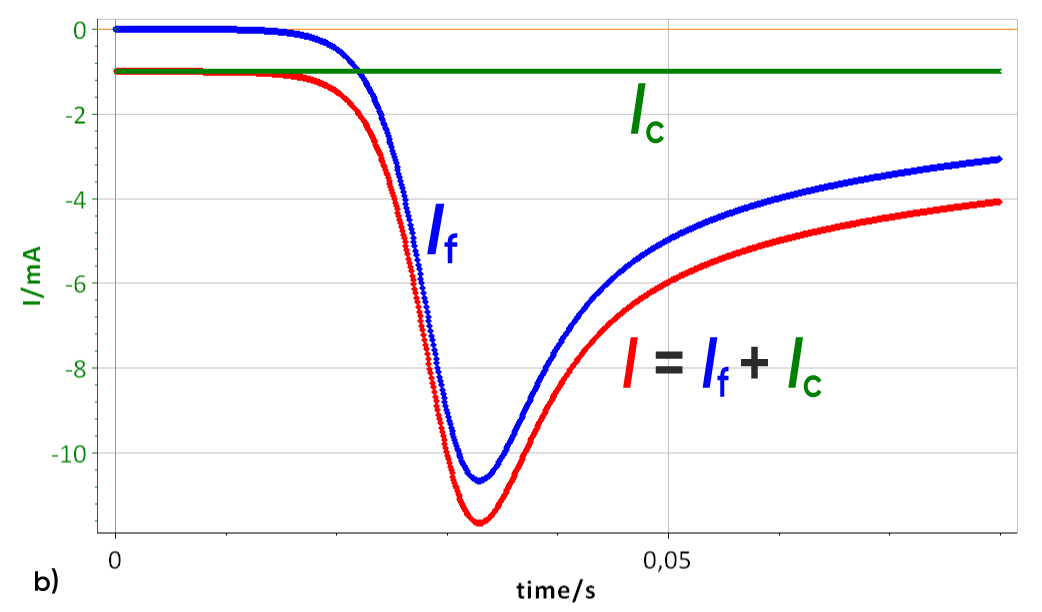
As the scan rate is constant, the contribution of the double layer capacitance on the total current is also constant, as described by Eqs. 1 and 2. The capacitive current can be seen in Fig. 3b (green curve). In this case, the capa-citive current is lower than the Faradaic peak current. If the scan rate increases, the capacitive current becomes much more important and can reach higher values than the Faradaic current as can be seen in Fig. 4. The constant capacitive is equal to -100 mA with a peak current of -180 mA.
Note that CV Sim allows the user to plot the total current I, the capacitive current Ic and the Faradaic current If (File Selection window).

Figure 4: I vs. E curve with a 100 µF double layer capacitance obtained with a scan rate of 1500 V/s, total current I, Faradaic current If and capacitive current Ic.
Effect of RΩ
The same conditions as the preceding simulations were used except that Cdl was set to 0. Fig. 5 shows the I vs. E curve of a system with three different RΩ. The effect of the electrolyte resistance is not as straight-forward as the effect of the capacitance. As RΩ increases, both the peak potential and current (Ep and Ip, respectively) are shifted: Ep to lower values and |Ip| to lower values.
In Fig. 5, what is shown is not E(t) (the potential seen by the electrode) but vt, the actual control potential ramp or in other terms the actual potential applied by the potentiostat. However, the current is the actual current response of the system to the potential E(t). The effect of the resistance is to slow down the scan rate as for each time step, the actual potential seen by the electrode is lower than the control potential. This can be seen in Fig. 6, where the true potential seen by the electrode is plotted as a function of time for three electrolyte resistances.

Figure 5: I vs. E curve obtained with three different electrolyte resistances: 0, 20 and 100 Ω. Scan rate: 1 V.s-1.

The potential seen by the electrode is no longer linear when the electrolyte resistance is stops being negligible. What can also be seen is that the end potential increases with the ohmic drop, which shows that the average scan rate decreases as the ohmic drop increases. It was shown in the first part of this note, that for the two limiting cases of the (E) reaction, Ip is proportional to the square root of the scan rate. If the scan rate is lower, then the peak current is also lower. This explains why in Fig. 5, |Ip| decreases as RΩ increases.
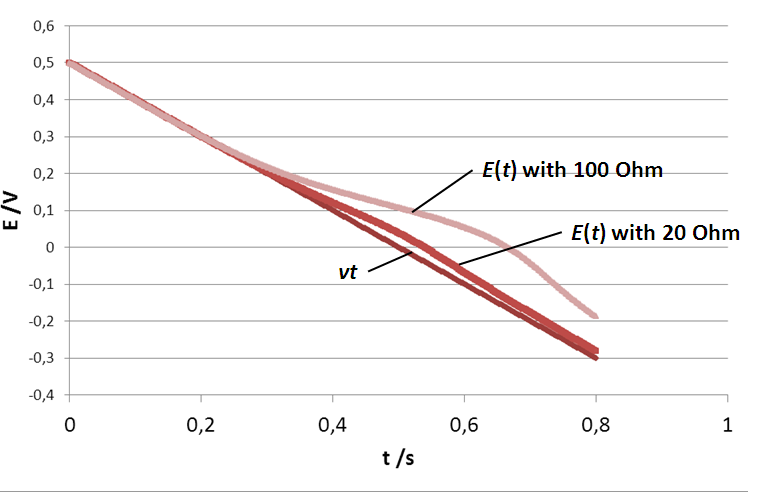
Figure 6: Potential ramp seen by the electrode with three different electrolyte resistances: 0, 20 and 100 Ω (control scan rate of 10 V.s-1).
Combined effect of Cdl and RΩ
The total current I, the capacitive current Ic and the Faradaic current If can be seen in Fig. 7 for which an ohmic drop of 20 Ω and a capacitance of 100 µF were used. It is clear that, contrary to Fig. 3b, the capacitive current is not constant with time. The capacitive current is related to the potential time variation dE/dt (Eq. 2), which in this case is not a constant, as the ohmic drop creates a non-linear potential variation. In other words, the expression dE/dt in Eq. 2 is not equal to v and is time-dependent.
The expression dE/dt becomes:
$$\frac{dE}{dt}=\frac{d\left(E_{init}+\nu t-R_\Omega I\right)}{dt} \tag{4}$$
Considering a constant scan rate, it gives:
$$\frac{dE}{dt}=-\nu+R_\Omega\frac{dI}{dt} \tag{5}$$
Inserting Eq. 5 in Eq. 2, we have a time-dependent expression of Ic :
$$I_c=-C_{dl}\left(\nu-R_\Omega\frac{dI}{dt}\right) \tag{6}$$


Figure 7 : a) I vs. t curve with Cdl = 100 µF and RΩ = 20 Ohm Total current I, Faradaic current If and capacitive current Ic. b) Inset of the total current at short times. The time constant tc and the capacitive current Ic can be determined.
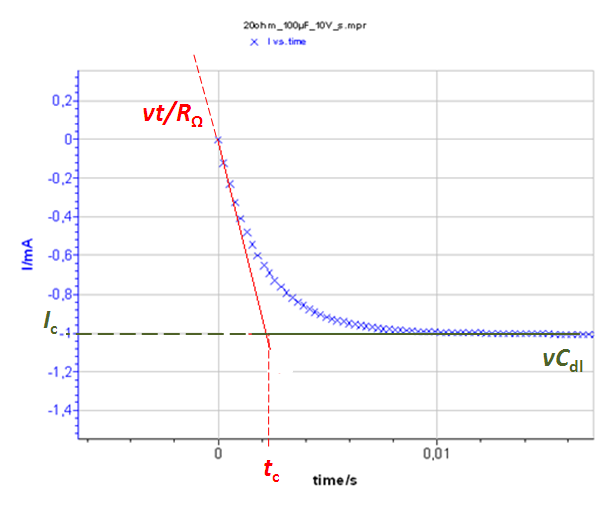

The system at short times (≈ 0,01 s) can be considered equivalent to an R+C circuit i.e. there is no Faradaic current. The current response of an R + C system to a constant potential ramp v is :
$$I=\nu\ C_{dl}\left(1-exp{\left(\frac{-t}{R_\Omega C_{dl}}\right)}\right) \tag{7}$$
The limit of this function at is vCdl, which is the capacitive current Ic (Fig. 7).
The slope of this function around t = 0 (which is equal to the value at t = 0 of the time derivative of eq. 2) is v/RΩ. The equation of the function is I(t) = vt/RΩ.
The intersection of these two curves is the time tc such that vCdl = vt/RΩ (Fig. 7). This time tc = RΩCdl. Consequently, knowing the scan rate and measuring the time constant as well as the capacitive current at large times (≈ 3 tc) allow the determination of the ohmic drop RΩ and of the double layer capacitance of the system Cdl.
Conclusion
The effects of the ohmic drop and of the double layer capacitance on the shape of the I vs. E curve of a single electron redox reaction was studied using CV Sim. In absence of ohmic drop, the potential E(t) seen by the electrode is the same as the control. The double layer capacitance only adds a constant capacitive current to the Faradaic current. The presence of an ohmic drop modifies the potential seen by the electrode, which is not a linear potential ramp anymore. In case of the presence of both an ohmic drop and a double layer capacitance, their values can be determined using the early current response. All these aspects can be simulated by CV Sim, which makes CV Sim a very useful tool for teaching purposes.
Data files can be found in :
C:\Users\xxx\Documents\EC-Lab\Data\Samples\Fundamental Electrochemistry\AN41_
References
- Application note #21 “Measurements of the double layer capacitance”
- J. Bard, L. R. Faulkner, Electrochemical Methods: Fundamentals and Applications, Wiley, Hoboken, (2001).
Revised in 08/2019


