

Nernst, Pourbaix and self-discharge
Latest updated: November 15, 2024INTRODUCTION
Self-discharge is the process by which a battery’s available capacity is spontaneously and irreversibly diminished by undesirable chemical reactions or electronic short circuits within the cell. Self-discharge occurs when the cell is disconnected and this differs from the loss of cell capacity when cell terminals are left connected to a device that is not being operated. It is defined as a percentage per month or per year and can be used to define a battery’s shelf life [1].
While self-discharge is not a state of equilibrium, the study of thermodynamics provides knowledge about possible reactions that can occur within a battery and how their kinetics may be reduced.
The basic equation for such a study is the Nernst equation, which gives the redox potential of an electrode immersed in a solution containing two species of a redox couple.
Nernst equations can be used to build Pourbaix diagrams, also known as potential-pH diagrams, which describe the dominant species and reactions as a function of pH and electrode potential.
By properly interpreting these diagrams, it is possible to explain the underlying mechanisms at play during the self-discharge of a commercial battery. Here, we use the historical example of the lead-acid battery because the Pourbaix diagrams of the chemical compounds present in these batteries are well known.
The Nernst equation
If we consider an electrochemical system composed of one inert electrode that is in equilibrium with the solution in which it is immersed, this solution can then contain two species of a redox couple as well as other electro-inactive species (e.g., supporting salt).
At the surface of the metallic electrode an equilibrium occurs with $k$ redox species and can be described as the following reaction [2, p. 40]:
$$\sum_{i=1}^k\nu_{\text{O}_i}X_i+n\text{e} \iff\sum_{i=1}^k\nu_{\text{R}_i}X_i \tag{1} $$
Where
$X_i$ are the species involved in the redox reaction, $\nu_{\text{O}_i}$ and $\nu_{\text{R}_i}$ are the stoechiometric coefficients of the reducing species $\text{R}$ and the oxidizing species $\text{O}$, respectively, or of a species reacting with one or the other, respectively, and $n$ is the number of exchanged electrons or stoechiometric coefficient of the electrons.
For example:
$$\text{Fe}^{3+}+\text{e}^-\iff \text{Fe}^{2+}\tag{2}$$
$$\text{I}_2+2\text{e}^-\iff \text{I}^{2-}\tag{3}$$
The Nernst relation gives the theoretical thermodynamic potential $E_\text{th,O/R}$ taken by the inert metallic electrode immersed in a solution where both redox species O and R are present:
$$E_\text{th,O/R}=E_\text{O/R}^°+\frac{RT}{nF}\ln\left(\frac{\prod_i a_i^{\nu_{\text{O}_i}}}{\prod_ia_i^{\nu_{\text{R}_i}}}\right)\tag{4}$$
Where,
$ E_\text{O/R}^°$ is the standard thermodynamic potential of the redox couple O/R, $R$ is the perfect gas constant, $T$ is the temperature, $F$ is the Faraday constant and $a_i$ is the activity, which can generally be approximated by the concentration.
For example, let us consider an inert electrode connected to an NHE(Normal Hydrogen Reference Electrode) in a solution containing 0.01 mol/L of $\text K_3 \text {Fe} \text {(CN)}_6$ $\left( \text{Fe}^\text{III} \right)$ and 1 mmol/L of $\text K_4 \text {Fe} \text {(CN)}_6$ $\left( \text{Fe}^\text{II} \right)$.
The redox reaction reaching an equilibrium at the electrode|electrolyte interface is:
$$\text {Fe} \text {(CN)}_6^{3+}+\text{e}^-\iff\text {Fe} \text {(CN)}_6^{2+}\tag{6}$$
And the Nernst equation:
$$E_{\text{th},\text {Fe} \text {(CN)}_6^{3+}/\text {Fe} \text {(CN)}_6^{2+}}=E_{\text
{Fe} \text {(CN)}_6^{3+}/\text {Fe} \text {(CN)}_6^{2+}}^°+\frac{RT}{F}\ln\left(\frac{ a_{\text {Fe} \text
{(CN)}_6^{3+}}}{a_{\text {Fe} \text {(CN)}_6^{2+}}}\right)\tag{7}$$
With $E_{\text {Fe} \text {(CN)}_6^{3+}/\text {Fe} \text {(CN)}_6^{2+}}^°=0.358/\text{ENH}$ [3], this gives:
$$E_{\text{th},\text {Fe} \text {(CN)}_6^{3+}/\text {Fe} \text {(CN)}_6^{2+}}=0.358+\frac{8.315 \times
298}{96485}\ln\left(\frac{10}{1}\right)=0.417\text{V}/\text{ENH}$$
Again, this relationship is only valid if both electroactive species of the redox reaction are present in the solution. If only one species is present, then we should consider a mixed potential involving another redox reaction.
In the next part, we will see how we can build a Pourbaix diagram using the Nernst equation described above.
The Pourbaix diagram
Water
$$\text{O}_2 + 4\text{H}^+ + 4\text{e}^-\iff 2\text{H}_2\text{O}\tag{8}$$
The Nernst equation writes:
Where the activity of water $a_{\text{H}_2\text O}=1$ and dioxygen is considered as a perfect gas at the atmospheric pressure of 1 bar, hence $a_{\text {O}_2} = P_{\text {O}_2}=1\,\text{bar}$.
At 298 K, $E_{\text{O}_2/ \text{H}_2 \text{O}}^°=1.23\,\text{V/ENH}$ and the Nernst equation now writes:
$$ E_{\text{th},\text {O}_2 /\text{H}_2\text{O}}=1.230-\ln10\frac{RT}{F}\text{pH}=1.230-0.0591\text{pH}\tag{10}$$
Where $\text{pH}=-\log a_{\text{H}^+}$ and $\ln x = \log x \ln10$.
Equation 9 can be plotted in an $E\,vs.\,\text{pH}$ diagram in which the given line represents conditions where both species of the redox couple have the same activities or concentrations. Above this line, the oxidizing (or reduced) species is stable or predominant, in our case $\text{O}_2$ and below this line the reducing (or oxidized) species $\text{H}_2\text O$ is stable or predominant.
Water is amphoteric and also an oxidizing agent. The reduction of water, or more precisely of the proton also called HER (Hydrogen Evolution Reaction), is conventionally written as:
$$2\text{H}^++2\text{e}^- \iff \text{H}_2 \tag{11}$$
The corresponding Nernst equation is:
$$E_{\text{th},\text{H}^+/\text{H}_2}=E_{\text{H}^+/\text{H}_2}^°+\frac{RT}{2F}\ln\left(\frac{ a_{\text{H}^+}^2}{a_{\text{H}_2}}\right)\tag{12}$$
Where $ E_{\text{H}^+/\text{H}_2}^°=0$, by convention and dihydrogen is considered as a perfect gas at the atmospheric pressure of 1 bar, hence $a_{\text {H}_2} = P_{\text {H}_2}=1\,\text{bar}$.
This gives:
$$ E_{\text{th},\text{H}^+/\text{H}_2}=-0.0591\text{pH}\tag{13}$$
This equation can also be plotted in $E\,vs.\,\text{pH}$ diagram and the plotted line represents conditions in which the activities or concentrations of $\text{H}^+$ or $\text{H}_2\text O$ and $\text{H}_2$ are the same. Above this line $\text{H}_2 \text O$ is stable or predominant and below this line $\text{H}_2$ is stable or predominant.
Figure 1 shows the Pourbaix diagram for water. The area between the dashed lines defines the region in which water has theoretical stability. If other species are present in water or an aqueous solvent and they are predominant in the region above the upper line (where water is not stable), then they can start being reduced and oxidize water into $\text{O}_2$. Similarly, at the same pH and lower potentials, predominant species below the lower dashed line (where water is not stable) can start being oxidized and reduce water into $\text{H}_2$.
We will see what happens when we consider lead in water by superimposing the Pourbaix diagram of water and that of lead.

Figure 1: Pourbaix diagram of water. Green zone: water’s stable zone.
Pb
As lead is the main component of lead-acid batteries it is relevant to show the Pourbaix diagram of Pb (Figure 2). It can be constructed using the same methodology as demonstrated for water. It is a bit more complex and involves more than two equations. For the sake of simplicity, we only highlighted Pb compounds that will be useful for our explanation of the mechanism of self-discharge.
The equilibrium reactions are:
$$\text{Pb} \text{O}_2+2\text{H}^++2\text{e}^-\iff \text{Pb}^{2+}+2\text{H}_2 \text O \tag{14}$$
$$\text{Pb}\iff\text{Pb}^{2+}+2\text{e}^-\tag{15}$$
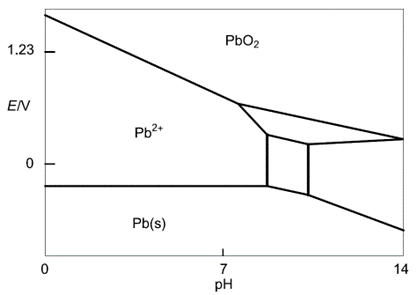
Figure 2: Simplified Pb Pourbaix diagram (reproduced from [4])
Self-discharge in a lead-acid battery
The active materials of the positive and the negative electrodes of a lead-acid battery are $\text{Pb}$ and $\text{PbO}_2$, respectively (Fig. 3). We consider for the sake of simplicity that the electrolyte is an acidic solution at pH 1.

Figure 3: Simplified components of a lead-acid battery
During discharge, at the positive electrode $\text{Pb} \text{O}_2$ is reduced in $\text{Pb}^{2+}$ (Eq. 14) while at the negative electrode $\text{Pb}$ is oxidized in $\text{Pb}^{2+}$ (Eq. 15).
Let us now superimpose the Pourbaix diagrams of water and Pb (Figure 4).

Figure 4: Superimposition of the water and the Pb Pourbaix diagram. An acidic solution at pH = 1 is considered.
We can see at low pH and higher potential that the $\text{O}_2$ predominant domain and the $\text{Pb}{2+}$ predominant domain overlap (Figure 5 – orange area). This means that, in this area $\text{Pb} \text{O}_2$ and $\text{H}_2 \text O$ are not stable and react with each other according to Eq. 8 in the oxidation reaction and Eq. 14, which gives:
$$\text{Pb} \text{O}_2+2\text{H}^+\rightarrow ½\text{O}_2+ \text{Pb}^{2+}+\text{H}_2 \text O \tag{16}$$

Figure 5: Superimposition of the water and the Pb Pourbaix diagrams, close-up of the unstable region for PbO2 and H2O (orange area).
This reaction represents the global discharge reaction of $\text{PbO}_2$, which is driven by the oxidation of water. It may cause a decrease in the battery’s $emf$, and more importantly, a decrease in the amount of active material of the positive electrode thus reducing the battery’s capacity.
In the red region in Fig. 6, $\text{H}_2$ and $\text{Pb}^{2+}$ are the predominant species, which means that $\text{Pb}$ and $\text{H}_2\text{O}$ are not stable and will react together according to equations 11 and 15, which gives:
$$\text{Pb}+2\text{H}^+\rightarrow \text{Pb}^{2+}+\text{H}_2\tag{17}$$

Figure 6: Superimposition of the water and the Pb Pourbaix diagram, close-up of the unstable region for Pb and H2O (red area).
This reaction, which is the global discharge reaction of $\text{Pb}$, may cause a decrease in the battery’s $emf$, and more importantly, a decrease in the amount of active material for the negative electrode thus reducing the battery’s capacity.
Both reactions occur spontaneously and independently, which means that even if the lead-acid battery is disconnected from an external circuit, it will “discharge spontaneously when not being used and its satisfactory operation will depend on frequent recharging” [4, p. 492]. However, the kinetics of these reactions are quite slow as the mixed potential of $\text{PbO}_2$ and $\text{Pb}$ electrodes in acid are not so far from their standard potentials [5].
We have described how Nernst equations could be used to plot Pourbaix diagrams and how these diagrams can be used to predict self-discharge mechanisms when certain redox species are in solution or coexist with other redox species.
If the Pourbaix diagrams of the electrodes materials are available, the same type of reasoning can be applied to other battery technologies (Ni-MH, Ni-Cd, LiB, LCO…) to potentially explain self-discharge phenomena.
References
[1] BioLogic Learning center:”Battery science: Interactive glossary of terms” https://biologic.net/topics/interactive-battery-science-glossary-of-terms/#Self-discharge,%20%/year
[2] B. Le Gorrec, C. Montella, and J.-P. Diard. Equilibres chimiques et Electrochimiques. Hermann, Paris, (2007) In French
[3] CRC Handbook of Chemistry and Physics, 76th Edition, R. C. Weast Editor CRC Press, INC. Boca Raton, Florida (1996) 8-25
[4] Atlas of electrochemical equilibria in aqueous solutions, M. Pourbaix, National Association of Corrosion Engineers, Houston, Texas (1974)
[5] J. Robert, J. Alzieu, Accumulateurs au plomb, Techniques de l’ingénieur, D 3 352 (In French)


