How to use electrochemical impedance spectroscopy (EIS) accuracy contour plots
Latest updated: June 2, 2023The importance of EIS accuracy contour plots
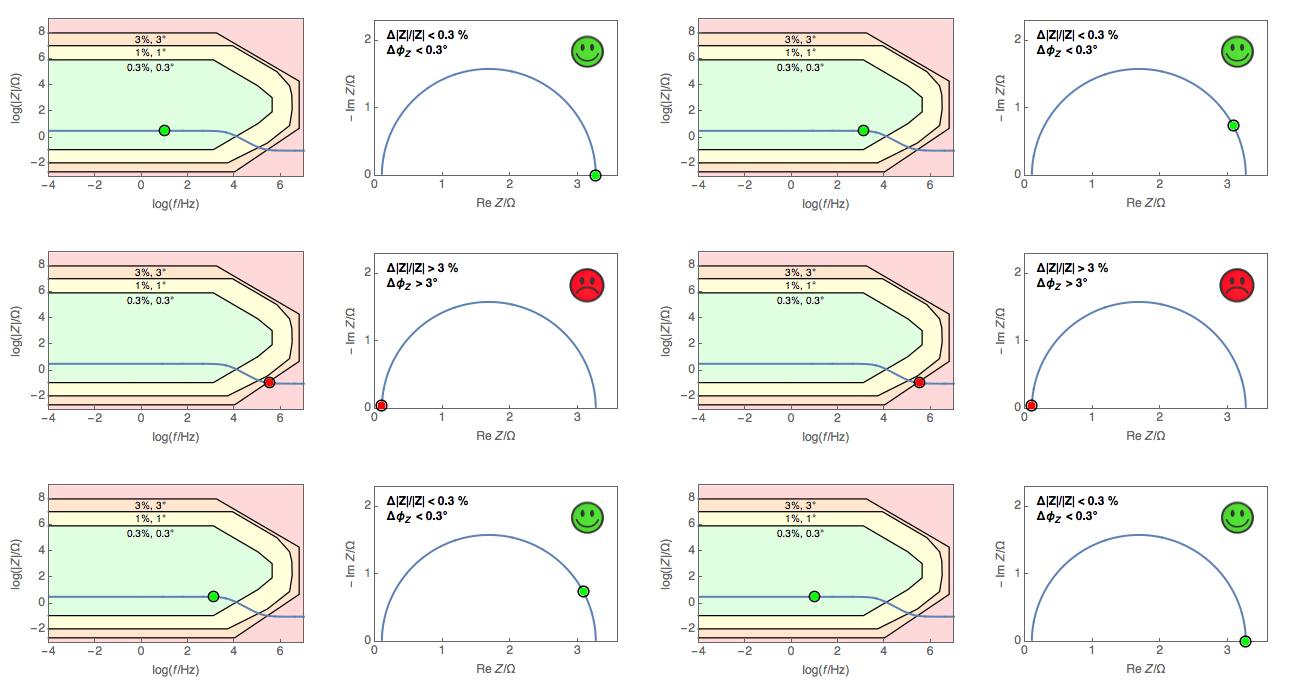
EIS accuracy contour plots must be used to interpret errors made during EIS measurements and identify the best frequencies possible to be used for a given impedance range. The aim of Fig. 1 is to demonstrate how to read and understand EIS accuracy contour plots provided with each potentiostat .

Fig 1: Superimposition of EIS accuracy contour plot and modulus
Bode diagram of R1+R2/C2 electrical circuit (left) and Nyquist diagram
of the same circuit (right).
The different colored areas show different ranges of impedances that can be measured at various frequencies within a specified error in magnitude (%) and in phase (°).
The accuracy contour plot is an image of the capability of the instrument and is only valid for a given set of conditions (input amplitude, temperature, data averaging, etc).
For more information see Application note #54: How to read EIS accuracy contour plots.
Related products