

How do I customize my plots?
Latest updated: November 15, 2024Most representations of interest for electrochemistry imply unit transformations like current density (mA/cm²) in the battery field or an adaptation of the axes which allows typical corrosion graphs like Tafel plot (Log <I> vs. Ewe).
EC-Lab allows great flexibility in the representation of data. In addition to 50 predefined representations that cover a wide range of applications, the set of measured or calculated variables can be plotted along a personalized axis.
Change the units
For energy and power units, only division by mass is currently available. Resistance units can be divided only by the surface of the electrode. This unit option enables you to display the Ragone plot, for example. The Ragone diagram is a graph commonly used to compare the performance of energy storage devices. It is a graph with logarithmic axes. The power mass density is plotted on the x-axis. The mass density of energy is plotted on the y-axis.
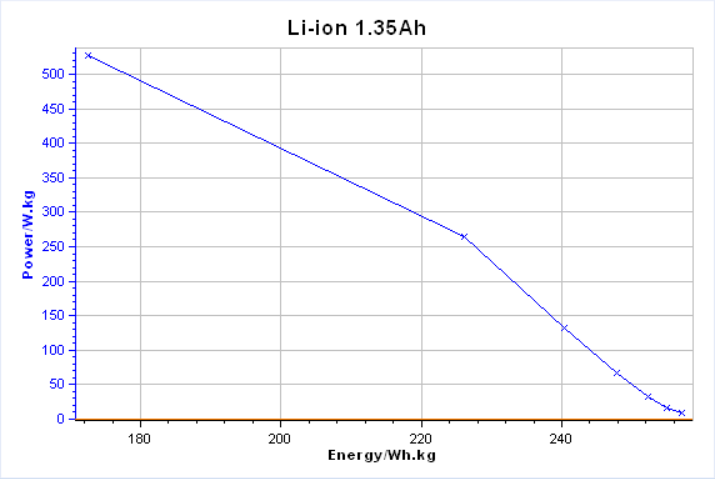
Ragone plot of 1.35Ah Li-ion Battery
Processing your axis
In addition to the traditional options for customizing the axes, EC-Lab offers the possibility to apply a mathematical expression on each axis. Processing the axes avoids creating additional variables to access a representation of interest. This enables you to create, for example, a Tafel representation (Fig 1) by applying a “log |Y|” operator to the Y-axis in the graph properties control panel.
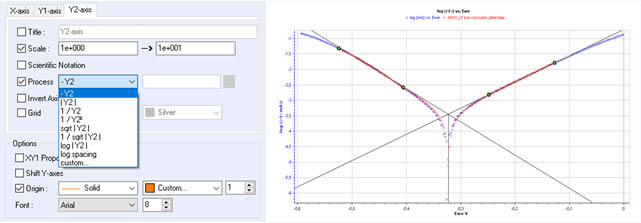
Fig 1: Y-axis processing to obtain a Tafel plot
Link the plot to a technique
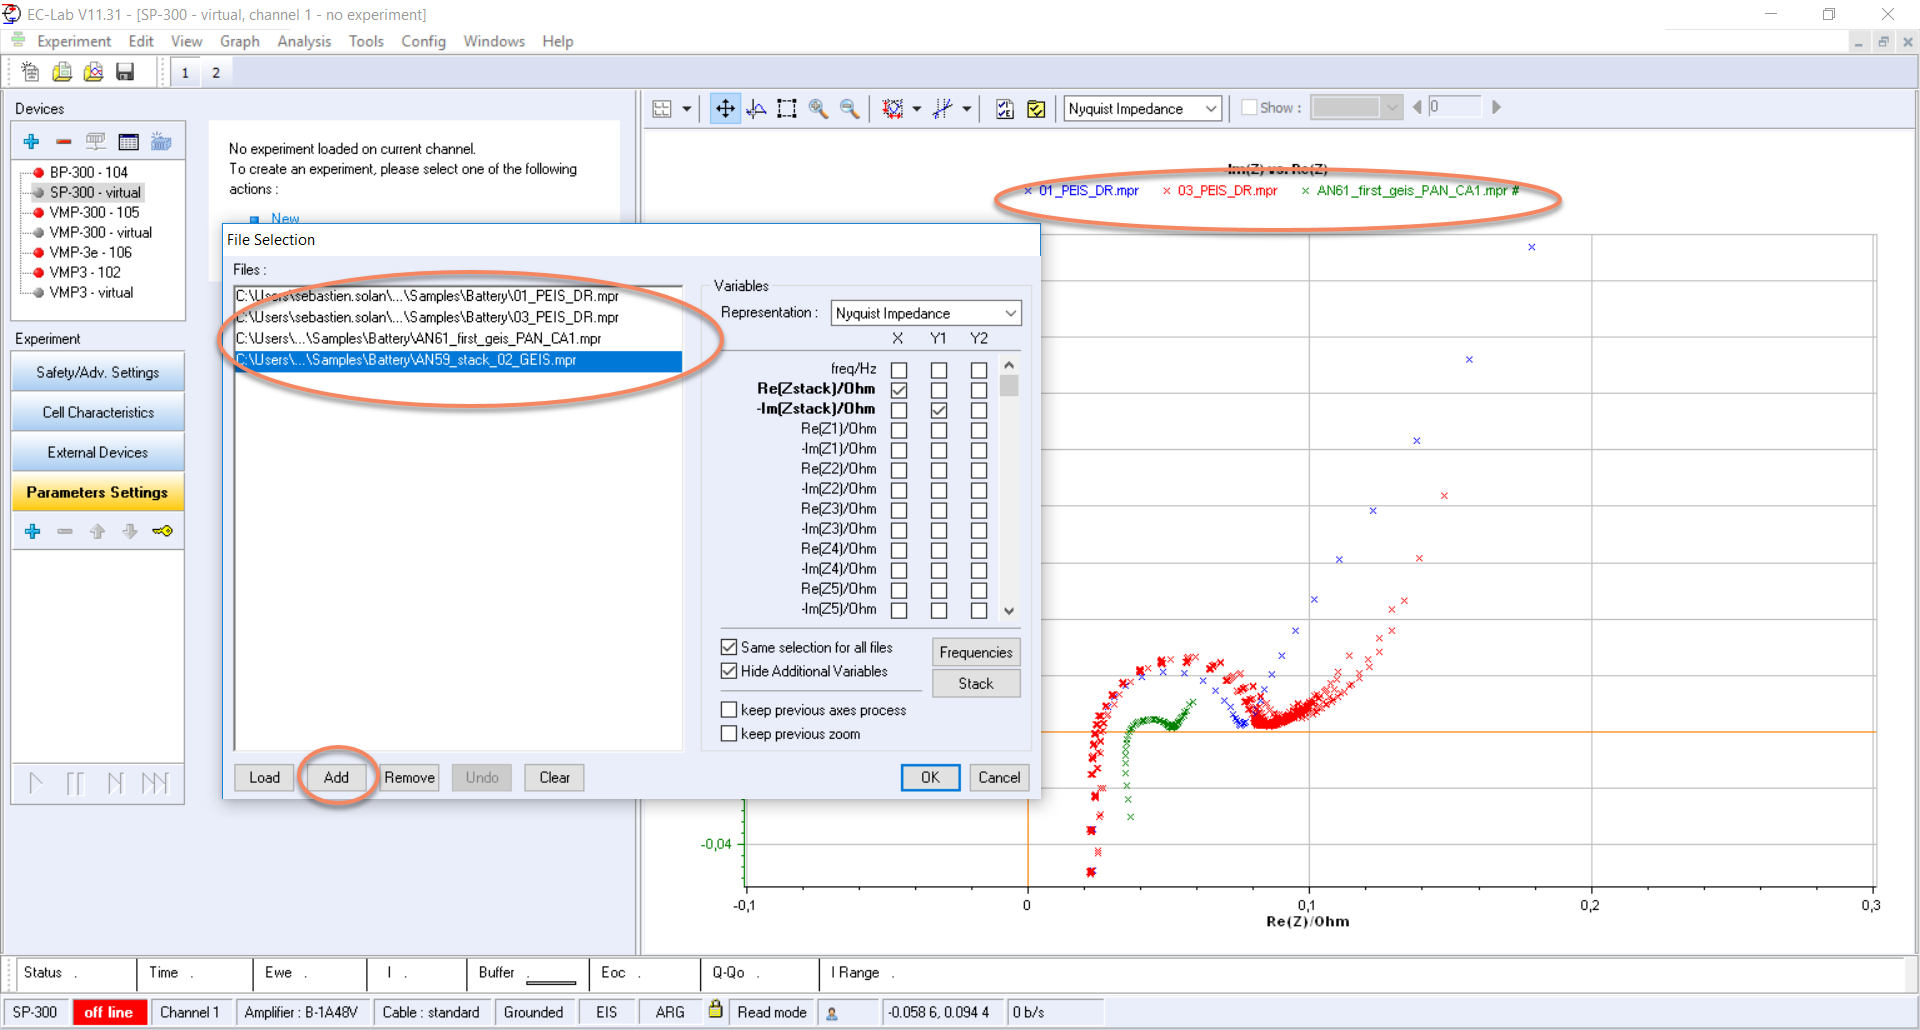
Depending on the electrochemical techniques used, it may be useful to configure your own representation and set your own axis or unit parameters. EC-Lab’s graph representation tool can be used to set and link any graph to a specific technique.

Compare several traces
All the modification tools (including those described above) can be used in the representation editor and all adjustments for fine-tuning will be saved as a custom graph representation. Once the association with a technique has been made, the data will be displayed based on this new representation, each time the technique is played.
Related documents:


