

Guidelines for proper Electrochemical Noise (EN) measurements
Latest updated: November 15, 2024What is electrochemical noise and why does it exist?
The Electrochemical Current Noise (ECN) is defined as the spontaneous current fluctuations occurring between two dissimilar or identical electrodes held at the same potential. These current fluctuations are due to a galvanic activity between two electrodes of the same material with microstructural differences (sometimes two dissimilar materials are used). ECN is usually measured using a Zero Resistance Ammeter (ZRA), which connects the two working electrodes. A reference electrode or a pseudo-reference electrode of the same material as the working electrodes can be used to measure the potential fluctuations, which are called Electrochemical Potential Noise (EPN). The first measurement of EPN for corrosion studies was described by Iverson et al. [1] in 1968, followed 15 years later by Electrochemical Current Noise (ECN) measurements [2]. Noise measurements can be used to evaluate the resistance (in this case noise resistance $R_n$) of a material to its general, homogeneous corrosion in a given environment, but also to gain insight into the mechanisms (pitting, crevice, stress corrosion cracking, intergranular corrosion, etc.) governing this local corrosion [3].
The noise measurements consist of sampling and collecting two signals: $I(t)$ and $E(t)$, whose nature can be considered as random. The signal aliasing is a known issue of the analog-to-digital conversion [4] used for measurement in digital potentiostats. Aliasing can lead to improper noise measurements. The use of analog filtering on oversampled data can limit the effect of aliasing. This is what will be presented in this topic.
Why use an anti-aliasing filter?
The signals obtained by a noise measurement technique, are representative of the random (stochastic) electrochemical activity. These signals are likely to be spread over a very wide range of frequencies and could be considered to be white noise. In the frequency domain, white noise is represented as a signal of equal intensity at all frequencies.
The use of a digital potentiostat/galvanostat allows us to be able to easily represent and analyze the acquired data with a computer. Analog signals are sampled, and a sampling frequency must be chosen. This frequency really depends on what the user considers the upper-frequency limit of interest of the signal, let’s call this frequency $f_{\text{max}}$.
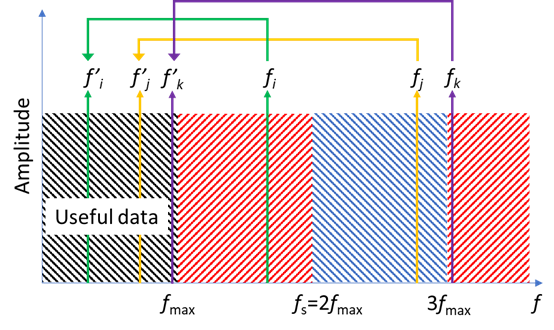
All the frequencies below this frequency are considered to be of interest (Fig. 1). First of all, the Nyquist-Shannon theorem tells us that the sampling frequency should be at least twice the frequency of interest $f_{\text{max}}$:
$$f_{\text{Nyquist-Shannon}}=2 f_{\text{max}}\tag{1}$$
Figure 1a shows what happens if we do not use an anti-aliasing filter before sampling at $ f_{\text{s}}=2 f_{\text{max}}$: all the frequency components at frequencies above $f_\text{max}$ will contribute to the frequencies below $f_\text{max}$ at alias frequencies. $f’_i,\, f’_j,\, f’_k$ are the alias frequencies of $f_i,\, f_j,\, f_k$.
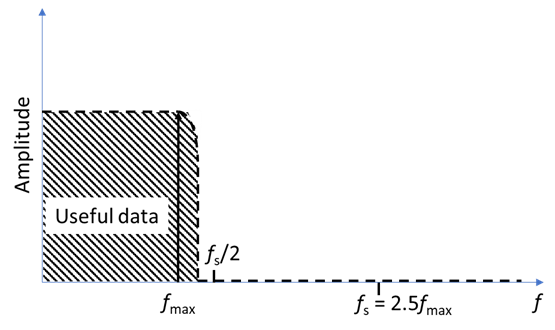
An ideal low pass anti-aliasing filter would remove all signals at frequencies just above $f_{\text{max}}$ (Fig. 1b), unfortunately in the analog world, such a filter does not exist. Analog filters have a defined cutoff frequency above which some of the signal is not completely suppressed.
For example, in Fig. 1c, because of the nature of the filter, some signals at frequencies above $f_{\text{max}}$ are only attenuated, at $f_{ia}$ for instance, and, when sampling at $f_{\text{s}}=2 f_{\text{max}}$ the useful data contains additional signal at the alias frequency $f’_{ia}$.
The trick is to sample at a higher frequency than $f_{\text{Nyquist-Shannon}}$, as depicted in Fig. 1d. Using a sampling frequency of for example $2.5 f_{\text{max}}$, we ensure that the frequency where the signal is highly attenuated by the filter is below $f_{\text{s}}/2$, hence all the measured signal is also below $f_{\text{s}}/2$ and no aliasing can occur. The measured signal should start being attenuated just above the frequency of interest $f_{\text{max}}$.
a)

b)

c)
d)
Figure 1 Amplitude spectrum in the frequency domain showing a) the aliased frequencies for frequencies higher than the frequency of interest,
b) the effect of an ideal low pass anti-aliasing filter, c) the effect of a real low pass anti-aliasing filter, d) how oversampling above the Nyquist
frequency can help reduce the residual aliasing.
Guidelines for proper noise measurements with BioLogic products
Which instrument should I use?
First of all, as was mentioned supra, proper noise measurements require analog filtering, which means that only Premium range instruments (or VMP-300 family) potentiostats must be used for noise measurements. Another reason for this is because the fluctuations are of very small amplitudes (several µA and several mV, at most), the most accurate instruments are necessary, that is to say, Premium range instruments (VMP-300 technology).
How do I set up my experiment in EC-Lab®?
The dedicated technique can be found in the Corrosion folder of Electrochemical Applications techniques (Figure 2) in EC-Lab®.
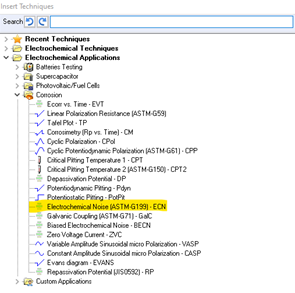
Figure 2: The ECN technique in the Corrosion folder in EC-Lab®.
The parameters of this technique are described in EC-Lab software technique and applications, we will only focus on the sampling rate $\text{d}t_{\text{q}}$ and the duration $t_{\text{i}}$ of the experiment.
How long should my experiment last?
Most EN analyses use the data represented in the frequency domain, so you need to reason in terms of frequency.
The duration of the experiment will determine the frequency resolution as:
$$\Delta f=1/t_{\text{i}}\tag{2}$$
With $\Delta f$ the frequency resolution in Hz and $t_{\text{i}}$ the duration of the experiment in s.
The lower $\Delta f$, the better, but then some constraints might come into play regarding $N$ the number of data points. First of all, if a Fast Fourier Transform (FFT) algorithm is used to analyze the data, the number of data points should be a power of 2:
$$N=2^M\tag{3}$$
With $M$ an integer that can be set arbitrarily to 9 [5], which means $N$ = 512
If the Discrete Fourier Transform (DFT) algorithm is used, which is a longer calculation. The only constraint on $N$ is your hard drive space and how much time you can spend on the measurement.
The second constraint then comes from the following equation:
$$N= t_{\text{i}}/\text{d}t_{\text{q}} \Rightarrow t_{\text{i}}=N \text{d}t_{\text{q}}\tag{4}$$
Which sampling rate should I use?
As mentioned supra, to avoid aliasing, the trick is to use analog filters on oversampled data. Premium range instruments have three analog filters at three cutoff frequencies: 50 kHz, 1 kHz, and 5 Hz. Let us name these cutoff frequencies $f_{\text{ca}}$. These filters are available in the Safety/Advanced Settings tab in EC-Lab® (Fig. 3).

Figure 3: Safety/Advanced Settings tab in EC-Lab® showing the choice of analog filtering
on $E$ and $I$ before sampling and digital conversion
This cutoff frequency will actually define the max frequency or frequency of interest, that needs to be available in the signal and that depends on the type of processes that are relevant.
As explained in the first part of this article, the sampling frequency should be more than twice the cutoff frequency of the filter. If we choose, as an example $2.5 f_{\text{ca}}$, this means that:
$$1/\text{d}t_{\text{q}}=f_{\text{s}}=2.5 f_{\text{ca}} \Rightarrow \text{d}t_{\text{q}}=1/(2.5 f_{\text{ca}})\tag{5}$$
Where $ f_{\text{s}}$ is the sampling frequency.
Factor 2.5 was chosen in agreement with the quality of the low pass filters available in BioLogic potentiostats. This factor is related to the order of the filter, the lower the order, the higher the factor.
Examples
Following the relationships presented before, we have basically three sets of conditions which are described in the table below:
| $f_{\text{ca}}$ | $\text{d}t_{\text{q}}$ | $t_{\text{i}}$ for $N=512$ |
| 5 Hz | 0.08 s | 40.96 s |
| 1 kHz | 0.4 ms | 0.2048 s |
| 50 kHz | 8 µs | 4.096 ms |
Table I: Sets of conditions to be used in the ECN technique to perform proper noise measurements with $N=512$.
Please note that the lowest acquisition time in EC-Lab® is 200 µs so it will not be possible to have 50 kHz as a max frequency.
Please also note that the calculations were made for $N=512$, in case longer durations are needed, which might be the case, if, for example, you realize that the system somehow takes some time to become invariant, in which case it might be necessary to repeat the above-mentioned sequence and take only the last one.
Analyses
Xia et al. [6] presented an exhaustive list of the different ways of interpreting noise data using time-domain, frequency-domain, and time-frequency domain analyses.
One common analysis is the calculation of the noise resistance $R_\text{n}$ using Power Spectral Densities (PSD). Detailed guidelines are given in [5] to perform this calculation which requires a Fourier Transform of the signal, using a specific window and detrending. A description of the tools available in EC-Lab® to perform these pre-treatments are described in application note 39-3.
References
- W. P. Iverson, J. Electrochem. Soc. 115 (1968) 617.
- J. L. Dawson, K. Hladky, D. A. Eden, “Electrochemical Noise – Some New developments in Corrosion Monitoring”, Proc. of the Conf. UK Corrosion (1983), 99-108
- R. A. Cottis, Corrosion 57, 3 (2001) 265.
- I.N. Bastos, F. Huet, R.P. Nogueira, P. Rousseau, J. Electrochem. Soc. 147, 2 (2000) 671-677.
- F. Huet, S. Ritter, Corrosion 74, 12 (2018) 1457–1465.
- D.-H. Xia, S. Song, Y. Behnamian, W. Hu, Y. F. Cheng, J.-L. Luo and F. Huet, J. Electrochem. Soc. 167 (2020) 081507


