

Review and principles of conductivity measurementMaterial Science – Application Note 2
Latest updated: June 12, 2024Introduction
The electrical conductivity is a physical property of a material quantifying its ability to transport charged species (called charge carriers), in the presence of an electrical field. It is an intrinsic property of the material and depends on both the mobility and the concentration (or density) of the charge carriers (electron, holes, ion, etc) [1].
According to the type of the charge carrier, different terms can be used to refer to electrical conductivity: electronic conductivity, ionic conductivity, electrolytic conductivity, protonic conductivity (H ), etc. So according to the predominated charge carrier, a material can be classified as:
- Electronic conductor: material where the conductivity is due to electrons or holes (metals and metallic alloys, semiconductors, some oxides, etc).
- Ionic conductor: material where the conductivity is due to ionic charge carriers (Li+, Na+, Ag+, H+, O2-, etc.)
- Mixed conductor (known as Mixed Ionic and Electronic Conductor (MIEC)): material where the conductivity is due to electronic and ionic charge carriers.
The aim of this note is to describe the principles and methods used for conductivity measurement. Two examples illustrating DC and AC conductivity measurement and the difference between DC and AC methods are given here.
Conductivity Measurement
The electrical conductivity (the reciprocal of the resistivity) of a material at room temperature can vary by over twenty orders of magnitude [1]. It is determined from the material resistance R using the equation below:
$$\sigma = \frac{1}{R}\frac{l}{A}\tag{1}$$
Where R is the resistance of a constant section sample, l and A are the length (or thickness) and the sample’s cross-sectional area, respectively. The resistance R may be determined either by a DC or AC method. For both methods two setups are possible:
- Four-point setup for high conductivity materials, where the impedance of the cell cable and connectors are not negligible vs. that of the tested material. In this configuration, the current and the voltage leads of the cell cable are independent which avoid the contribution of the impedance of current leads in the measured impedance.
- Two-point setup for intermediate and high impedance materials, where the impedance of the cell cable and connectors are negligible vs. that of the material.
In contrast to resistance or conductance, which depends on the size/dimension of the sample material, the electrical conductivity is an intrinsic and intensive physical property which is independent of the size and the shape of the tested material. However, it does depend on some parameters like temperature, humidity and sometimes the direction/orientation of the material and its previous history. For accurate conductivity measurements, an accurate control of these parameters is required.
Measurement Methods
DC Method for DC Conductivity
The most common method for the measurement of electrical conductivity is the Direct Current method. This method consists in applying a DC voltage (or a DC current) to the sample and measuring the resulting current (or voltage) flowing through the sample. If the measurement is performed at several points, the resistance of the material corresponds to the inverse of the slope of the current vs. voltage plot.
Figure 1 shows an example of resistance measurement performed on an electronic conductor (Nickel, l= 100 mm,φ = 2 mm) at 20 °C.  Figure 1: I vs. E plot of pure Nickel obtained by DC technique.
The electronic conductivity of the Nickel wire at 20 °C computed using the equation (1) is σ(Ni) = 1.34×10⁷ S·m-1. This value is close to the electrical conductivity of 1.34×10⁷ S·m-1 given in the literature [3]. More details on this measurement can be found in the reference [4].
AC Method for AC Conductivity
Alternating Current method is based on the impedance spectroscopy measurement which consists in measuring the electrical response of a material to a sinusoidal signal at different frequencies. The AC method has the advantage of minimizing the change of charge carrier concentration during the measurement. Indeed, for an ionic material, DC method leads to an accumulation of charge carriers at the electrodes. This leads to the appearance of additional capacitances which causes a drop of the applied potential over the sample and affects the magnitude of the measured conductivity of the cell. This phenomenon is known as electrode polarization. This phenomenon is easily eliminated by AC method [5].
The frequency range to be chosen for impedance measurement depends on the relaxation frequencies of phases present in the sample and on the microstructure [5]. Figure 2 shows an example of impedance data of an ionic material sample (l = 1 mm, Φ = 12 mm). The material is Yttria Stabilized Zirconia (ZrO2)1-x(Y2O3)x with x = 0.05 (denoted as 5YSZ). Its conductivity was measured at 700°C with the AC method using MTZ-35 impedance analyzer in the frequency range 10 MHz – 1 Hz [6]. The Nyquist diagram of YSZ5 displays two depressed semicircles: one at high frequencies and a second one at low frequencies. The high frequency semicircle is associated with the bulk (or the grain) conductivity response. The low frequency response is attributed to grain boundary conduction.  Figure 2: Impedance data of YSZ5 at 700°C.
As it can be seen on Fig. 2, the two semicircles are depressed. The impedance data was fitted to the equivalent circle shown in Fig. 3. This circuit consists of R1/Q1+R2/Q2: R1/Q1 models the grain conduction and R2/Q2 represents the conduction through the grain boundaries. 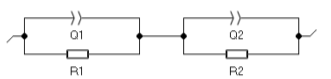
Figure 3: Equivalent circuit. The bulk conductivity of the sample σG at 700 °C was calculated using Eq. (1) with a bulk resistance R= 467 Ω and a cell constantk= 0.088 cm-1, and σG= 1.88×10⁻⁴ S·cm-1. More details on ionic conductivity of 5YSZ can be found in the reference [6].
AC Conductivity vs. DC Conductivity
Unlike DC method which provides a global response of the cell, AC method distinguishes between different mechanisms involved in the overall conductivity response of a material like grain conduction, grain boundary conduction, electrode response, diffusion processes, etc [7].
AC conductivity σac(ω) can be expressed as the sum of two components [8-10]: A frequency-independent conductivity σdc and a frequency-dependent conductivity σ(ω)
$$\sigma_{ac}= \sigma_{dc}+ \sigma(\omega)\tag{2}$$
$$\sigma_{ac} = \sigma_{dc}+ A \omega^n\tag{3}$$
Where σ(ω) is a power law frequency dependent function observed in a wide variety of materials. A is a pre-exponential factor dependent on temperature, and n is an exponent (0 < n <1).
At lower frequencies (ω → 0) σ(ω) → 0, so AC conductivity is equal to DC conductivity which has a constant magnitude.
Conductivity Anisotropy
As mentioned above, electrical conductivity is independent of the size and the shape of the material, however it could depend on the position (inhomogeneous material) or on the orientation and the direction at which the conductivity is measured (anisotropic material). The conductivity anisotropy is mainly related to the structure and the elaboration process of the material.
Many materials exhibit an anisotropy conductivity. This anisotropy can be investigated by measuring the conductivity in different direction of the material. Some sample holders like In-plane CESH allows conductivity measurement in different directions of the plane of the sample. The through-plane CESH allows conductivity measurement in the perpendicular direction of the plan of the sample (Fig. 4).
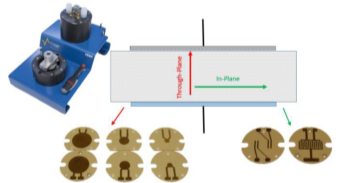
Figure 4: CESH sample holder with its electrodes for Through-plane and In-plane conductivity measurement.
Cell Constant
Electrical conductivity is computed from the measured impedance using Eq. (1). The geometrical factor l/A depends on the geometry of the sample holder (electrode area A) and the sample’s thickness l.
Cell constant can also be determined using material with well-known conductivity. These materials are reference samples or a standard solution for liquid or electrolytic conductivity.
Conclusion
This note has described the principles and methods used for conductivity measurement. Two examples of conductivity measurement using DC and AC was given in order to show the differences between the two methods.
References
1) R. M. Almeida, Handbook of sol-gel science and technology, processing, characterization and application Vol 2. Characterization of solgel materials and applications, Ed Sumio Sakka, (2005).
2) Michael B. Heaney. The Measurement, Instrumentation and Sensors Handbook, chapter Electrical Conductivity and Resistivity. CRC Press, (1999).
3) ASM specialty Handbook. Nickel, cobalt, and their alloys. J. R. Davis. Editor (2000) 3.
4) Application Note #3, Electrical conductivity of materials. Part I: Electronic conductivity measurement.
5) E. Barsoukov, J. Ross Macdonald, Impedance Spectroscopy: Theory, Experiment, and Applications, 2nd Edition, John Wiley & Sons, Inc, (2005).
6) Application Note #1, Electrical characterization of a ceramic with MTZ-35 and HTSH1100 test fixture.
7) P. J. Gellings, H. J. M. Bouwmeester, CRC Handbook of Solid State Electrochemistry, CRC Press, (1997).
8) F. Yakuphanoglua, Y. Aydogdua, U. Schatzschneiderb, E. Rentschlerb, Solid State Communications 128, (2003) 63.
9) S. Barrau , Ph. Demont , A. Peigney, Ch. Laurent , C. Lacabanne, macromolecules, 36, (2003), 5187. 10) S.R. Elliott, Adv. Phys. 36, (1987) 135.


