

Electronic conductivity measurement – DC/AC methods Material Science – Application Note 3
Latest updated: June 13, 2024Introduction
Electrical conductivity is an intrinsic physical property of materials. The principles of the measurement were described in the application note #2 [1].
This note explains how to perform conductivity measurements on an electronic conductor using a DC method and an impedance spectroscopy method. The conductivity values obtained by both methods are compared to those reported in the literature.
Experiment
A pure Nickel (99.98%) wire with a 2 mm diameter (Goodfellow, Ltd. UK), was chosen as an electronic conductor for the test.
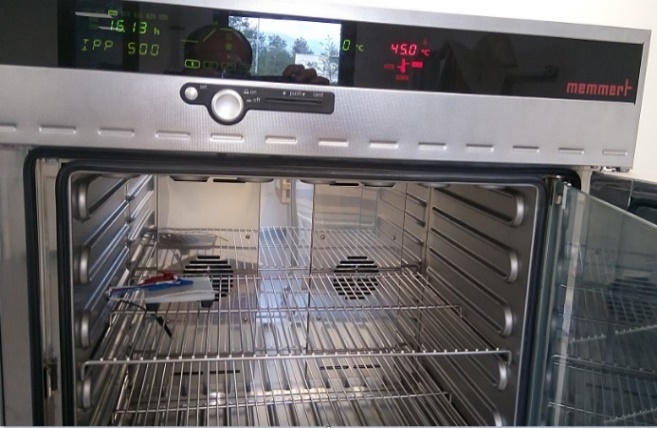
AC and DC conductivity measurements were performed with a SP-300 potentiostat/FRA. These measurements were carried out at constant temperature (T = 20 °C) using a Memmert IPP500 temperature chamber. The temperature was measured by a PT100 probe and recorded by EC-Lab® software. The measurements were launched 15 min after the stabilization of the temperature at 20 °C. This settling time was set to ensure that the sample reached the thermal equilibrium with the temperature of the chamber (Figs. 1 and 2).
The electrical conductivity of the sample was then determined using the equation below [2]:
$$\sigma = \frac{1}{R}\frac{l}{A}\tag{1}$$
R is the sample’s electrical resistance. l and A are the length and the cross-sectional area of the sample, respectively.

Figure 1: Experimental setup.
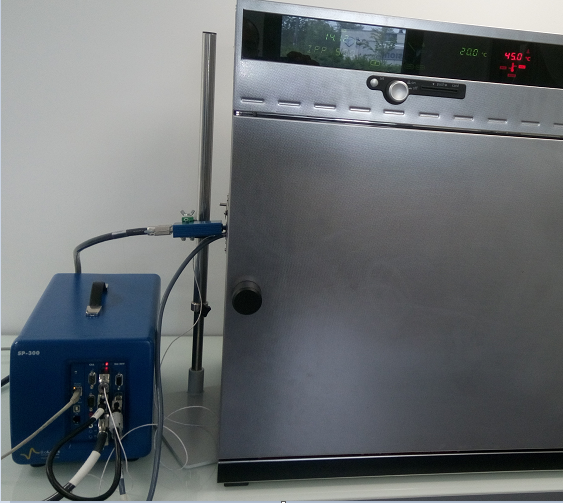
A four-point setup was used for AC and DC measurements. The PT100 probe was placed close to the sample. Figure 2 shows the four-point measurement setup used for AC and DC conductivity measurements.

Figure 2: Four-point conductivity measurement.
DC Method
DC conductivity method has been used first for the measurement of the electrical conductivity of the pure Nickel. A linear potential scan was applied to the sample with a scan rate of 5 mV/s. Figs. 1 and 2 show experimental settings used for DC conductivity measurement.
The sense leads of the SP-300 cell cable (S1 and S2) were used for voltage control and measurement. The current was measured between the current leads P1 and P2. Figure 3 illustrates the connection of the sample to the cell cable of the SP-300 potentiostat.

Figure 3: Scheme of four-point setup.
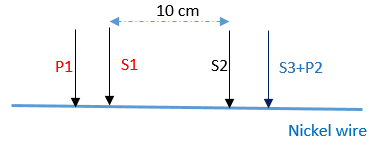
Note: Two-point measurement is not adapted for measurement of conductivity of a conductive material. In general, if the impedance of leads/connectors are in the same order of magnitude as that of the sample, a four-point measurement is required.
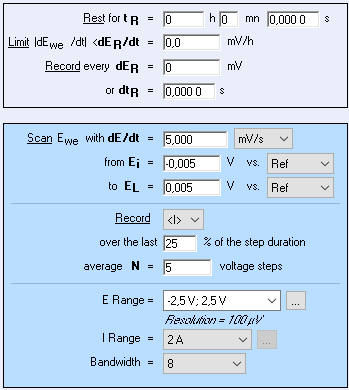
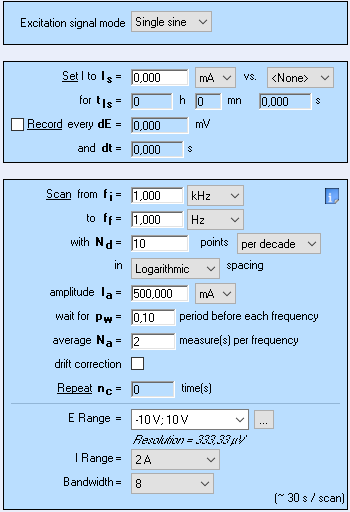
As pure nickel is a very conductive material a small voltage generates a high current which is why a 2A current booster was used with the SP-300. A low voltage range of +/- 5 mV and a scan rate of 5 mV/s were chosen as a good compromise between having enough points on the I vs. E plot and avoid heating up the sample. Figure 4 shows the settings of Linear Scan Voltammetry technique used for DC conductivity measurement.

Figure 4: Linear Scan Voltammetry (LSV) settings.
AC Method
As stated before, the sample is very conducti-ve. A small voltage amplitude generates an important current and so even a small inaccu-racy on the applied voltage generates an important inaccuracy on the measured current. This is why for low impedance systems, applying a sinusoidal current instead of a sinusoidal voltage results in higher accuracy impedance measurements.
The experimental setup shown in the Figs. 1 and 2 was used for the measurement of the conductivity of the Nickel wire using Galvano- impedance spectroscopy technique (GEIS). Figure 5 shows the experimental settings used in the GEIS experiment.

Figure 5: GEIS settings.
Results & Discussions
DC Method
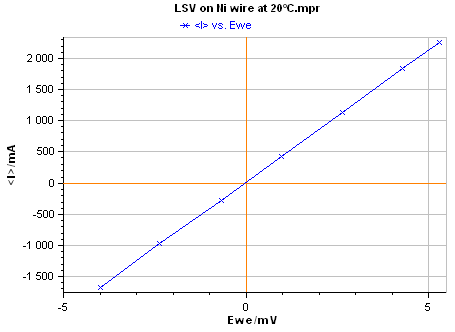
The I vs. E plot of pure Nickel acquired by EC-Lab® software is given in Fig. 6. The measurement was performed at T = 20 °C.

Figure 6: I vs. E plot of pure Nickel.
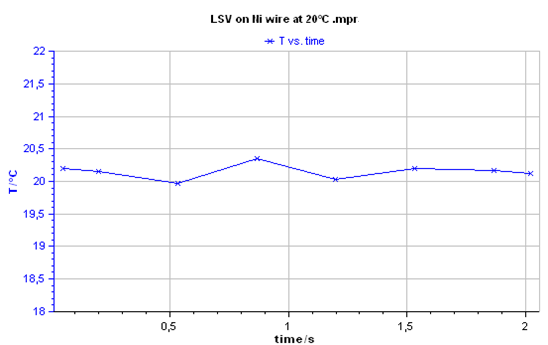
The measured temperature during LSV measurement is given below:

Figure 7: Temperature plot during LSV test (20 °C).
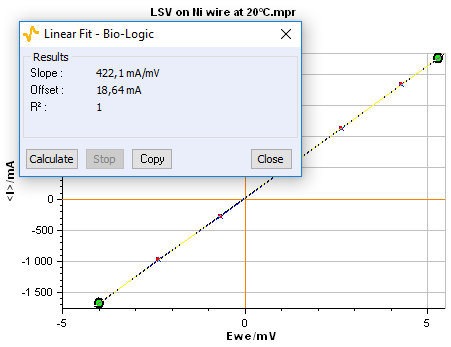
The electrical resistance of the sample (l = 100 mm, f = 2 mm) corresponds to the inverse of the slope of I vs. E plot obtained by Linear Fit (Fig. 8). Using Eq. 1, the obtained resistance (R = 2.37 mΩ) gives a conductivity value s = 1.34 107 S.m-1.
This value agrees well with the literature value given at 20 °C which corresponds to a conductivity value of s = 1.46 107 S.m-1 (ρ = 68.44 nΩ.m) [3].

Figure 8: Linear Fit window.
AC Method
The electrical conductivity of pure nickel was also measured by impedance spectroscopy using the GEIS settings shown in Fig. 5. The obtained impedance data are displayed in Fig. 9.

Figure 9: Impedance Nyquist plot of Nickel at 20 °C.
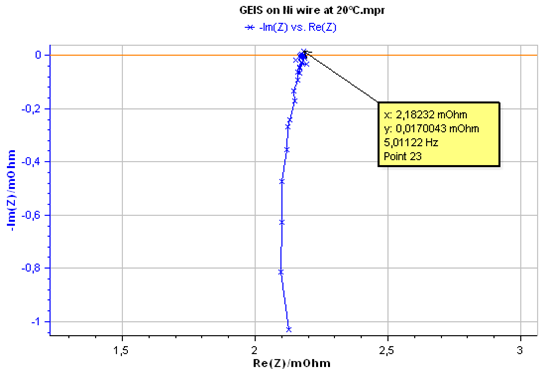
The impedance data were fitted to a resistance R (Fig. 10), The Z Fit tool provides a resistance value of 2.176 mΩ. This value was used for computing electrical conductivity of Nickel using Eq. 1. The obtained value of conductivity by AC method is σ(Ni) = 1.46 107 S.m-1.

Figure 10: Impedance data fitting to a resistor.
The electronic conductivity of Nickel measured by DC and AC methods is in a good agreement with the electronic conductivities values reported in the literature. The resistivity of pure nickel at 20 °C is 68.44 nΩ.m [3] which corresponds to a conductivity of 1.46 107 S.m-1.
The conductivity values obtained by DC and AC methods are summarized in Tab I.
Table I: Summary of conductivity values obtained by DC and AC methods.
| Method | DC | AC | Literature |
|---|---|---|---|
| Resistance/mΩ | 2.370 | 2.176 | – |
| Conductivity (x107)/S.m-1 | 1.34 | 1.46 | 1.46 |
Conclusion
The electrical conductivity of pure nickel was measured with DC and AC methods at a fixed temperature of 20 °C. The results showed a good agreement between the values obtained with DC and AC methods, and the value reported in the literature.
References
1) Application Note #2 “Electrical conductivity of materials: review of principles of measurements”.
2) Michael B. Heaney. The Measurement, Instrumentation and Sensors Handbook, chapter Electrical Conductivity and Resistivity. CRC Press, (1999) 1335.
3) ASM specialty Handbook. Nickel, cobalt and their alloys. J. R. Davis. Editor (2000) 3.


