

UFS-SEC: SpectroElectrochemical Cell for UV-Vis, NIR and IR measurement Spectroelectrochemistry – Application Note 52
Latest updated: January 31, 2024Abstract
In this application note, the use of a unique thin layer spectroelectrochemical cell is presented. Initially, experimental information about the setup is presented. Then, the specificity of the thin layer cell is discussed. Finally, UV-Vis and IR measurements are shown.
Introduction
The tandem application of spectroscopy to electrochemistry can be done either ex situ or in situ. In some cases the ex situ method may be of limited use, in that something could change upon removing the sample from the electrolytic solution under the control of the working potential. This possible drawback can be circumvented by in situ spectroelectrochemistry, in which the measurement is carried out simultaneously with the redox change. On the other side, while ex situ measurements do not require special spectroscopic apparatus, in situ experiments need special cells planned at the best compromise between the requirements of spectroscopic and electrochemical techniques, which do not always coincide. A reasoned settlement concerning the size of the cell, the electrode geometry, the choice of the supporting electrolyte and the sample concentration is critical, consequently, many different cell designs and optically transparent electrodes developed for specific spectroscopic methods are described in the literature.
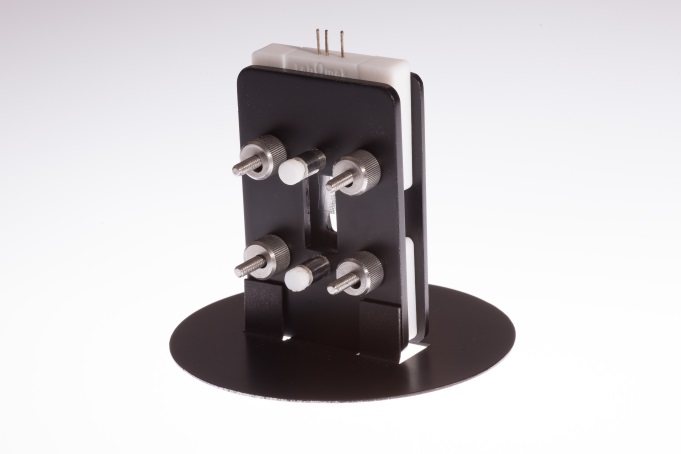
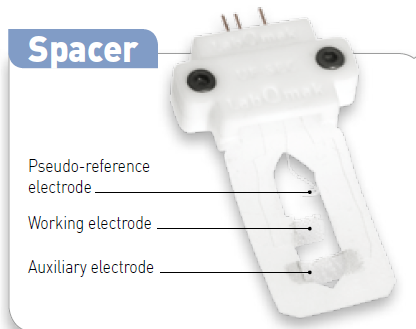
Fig. 1 : Thin-layer spectro-electrochemical cell (top). Zoom on the Electrode configuration, the so-called “spacer” (bottom).
In this application note, the use of a thin layer spectro-electrochemical cell is presented (Fig. 1). Firstly, experimental information about the setup is presented [1-3]. Then, the specificity of the thin layer cell is discussed. Finally, UV-Vis and IR measurements are shown.
Experimental considerations
The electrodes are wired to 2 mm banana plugs and so they can be connected to any BioLogic potentiostat (Fig .2).
The color of the wires is the same as the BioLogic standard i.e. red to working electrode, white to reference electrode (here pseudo-reference) and blue to counter electrode.
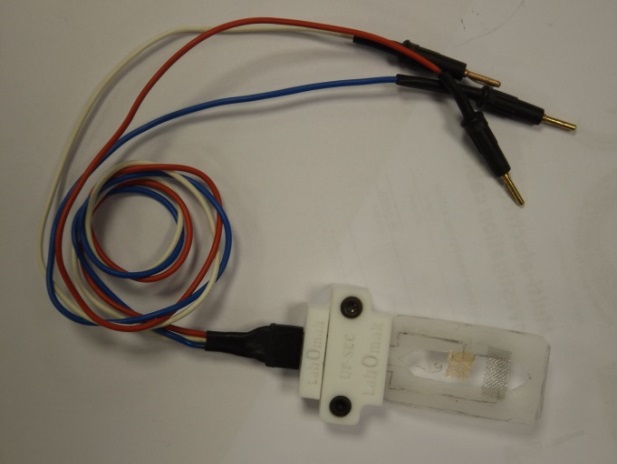
Fig. 2: The spacer with the three wires.
The cell can be placed directly in a bench spectrometer. Alternatively, optical fibres can be used to connect the cell to light source and to the spectrometer (Fig.3).
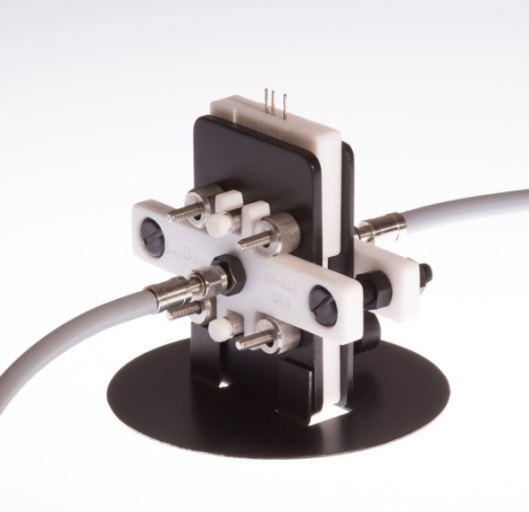
Fig. 3: Spectroelectrochemical cell with optical fibres.
Another point that has to be emphasized is the synchronization. EC-Lab® has a trigger ouput (available in the technique builder section) that allows the users to synchronize the spectro- (from spectrometer) and electrochemical (from the potentiostat) acquisition.
Measurement
General considerations
In such finite-diffusion conditions, a thin solution layer (about 0.2 mm) adjacent to the electrode is confined by the cell walls, so that the cell thickness is smaller than the diffusion layer and the mass transfer can be ignored. The most significant virtue of thin-layer cells is the absence of diffusion and the rapidity with which the electroactive species can be exhaustively electrolyzed. The dropping to zero of the current flow following the peak in the current potential plot is a characteristic behavior of thin-layer cells, indicating exhaustive electrolysis of the cell reactant and minimal diffusion effects in thin-layer electrochemical cells.
Small potential sweep rates (2-10 mV/s) are necessary both to ensure homogeneity of the reactant/product concentrations in the cell and to control the resistive effects.
In fact, one of the main problems with thin-layer cells is the iR gradient across the electrode surface and between the electrode and the bulk solution. This gradient may affect the shape of an electrochemical response, even if it does not affect quantitative determinations.
The iR drop can be also minimized by increasing the supporting electrolyte concentration.
The design of a thin-layer cell of exactly predetermined and fixed thickness is still a problematical matter. In fact, the narrowness of the thin cavity is, to a limited extent, dependent on the mounting procedure, so that exact reproducibility is practically difficult to achieve.
Anyway, this aspect can be easily overcome by using either a colorimetric calibration curve or, knowing the electrode area, by micro-coulometry recorded in the cell.
A CV should be registered in your SEC cell to better localize the redox process of your interest: in facts, the UF spacer has an Ag pseudo-reference electrode, which is sensitive to the solution medium (but is expected to remain constant in time in each given experimental condition). Potential drifts can be possibly observed in the presence of irreversible redox reactions, which may severely alter the solution/analyte composition.
Diffusion is limited in thin layer conditions, so you can run your spectra after the stepwise redox change of your sample, choosing the step size (potentials and time) according to your specific needs.
As discussed, to keep as low as possible the iR drop, the current i should also be kept low, this means that low scan rates and low sample concentrations may be preferred. Anyway, in some cases, due to the narrowness of the optical path, the use of a relatively high concentration of the sample may be required to study the changes of bands with a low molar extinction coefficient.
You should adjust the best experimental conditions for every specific experiment, even if, as a general rule, a millimolar concentration appears to be a reasonable compromise in many cases.
UV-Visible
A CV of ferrocene in dichloromethane with TBAPF6 as supporting salt (0.2 M) is shown in Fig. 4.
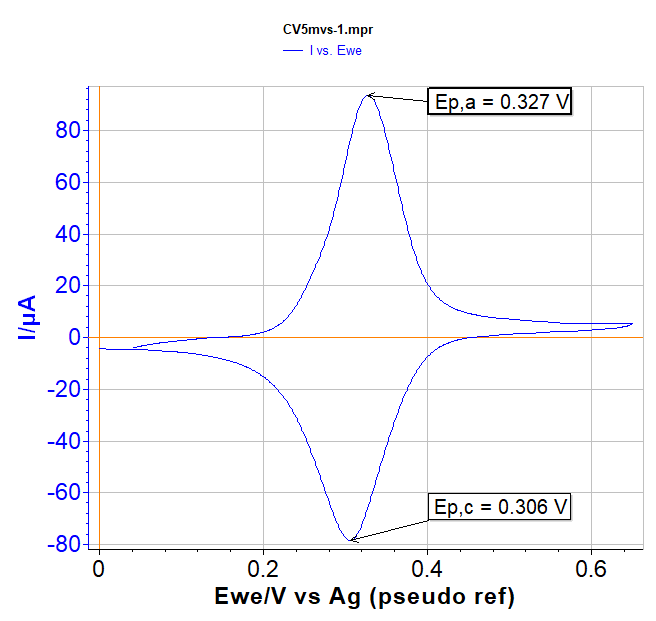
Fig. 4: CV of Ferrocene in CH2Cl2/TBAPF6 (0.2 M) at 5 mV/s.
During the potential sweep spectrometer data was collected every 50 mV. The starting potential is +150 mV. The resulting spectra are shown in Fig. 5.
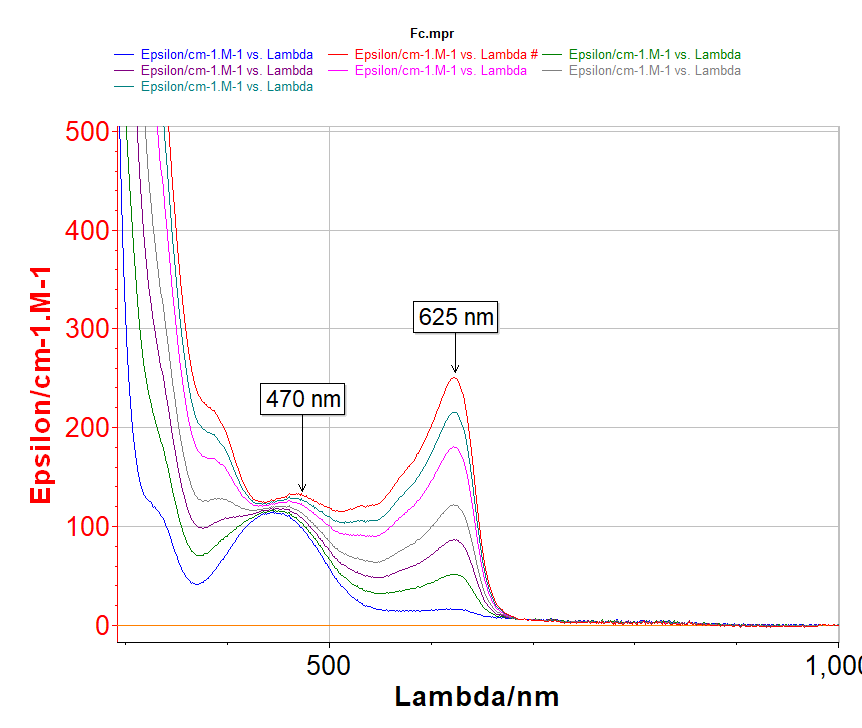
Fig. 5: UV-Vis spectra acquired during the potential sweep of ferrocene in CH2Cl2/TBAPF6 (0.2 M) at 5 mV/s. Initial potential: 150 mV. A spectra is measured every 50 mV.
Infrared
Due to the high Infrared absorbance of more common solvents and electrolytes, a very carefully measured background should be obtained before every IR spectroelectrochemical experiment. For the same reason, in these experiments it is also important to avoid changing the tightening of the cell screws during the experiment itself, to avoid changes of the optical path.
![Fig. 6: IR spectra acquired during the potential sweep of [Pt6(µ-PtBu2)4(CO)6]2+ (9 mM in CH2Cl2/TBAPF6 (0.2M). Initial potential: -100 mV. A spectra is measured every -50 mV.](https://biologic.net/wp-content/uploads/2019/08/an52f6.png)
Fig. 6: IR spectra acquired during the potential sweep of [Pt6(µ-PtBu2)4(CO)6]2+ (9 mM in CH2Cl2/TBAPF6 (0.2 M). Initial potential: -100 mV. A spectra is measured every -50 mV.
Conclusion
In this application note, it has been shown how to set up spectroelectrochemical investigations. In the last paragraph, spectroelectrochemical measurements (UV-Vis and IR) are shown.
References
1. Restyling of the cell design described by M. Krejčik, M. Daněk and F. Hartl, J. Electroanal. Chem. (1991) 317, 179.
2. P. Leoni, F. Marchetti, C. Bonaccorsi, F. Fabrizi de Biani, L. Marchetti, P. Zanello, Chem. Eur. J. (2008) 14, 847
3. UF-SEC: a User-Friendly spectro-Electrochemical Cell for UV-Vis, NIR and IR measurement, F. Fabrizi de Biani, P. Mugnai, A. Pellissier, International Meeting on Electrogenerated Chemi-Luminescene, 7th-10th september 2014, Bertinoro (IT).


