

SECM height relief with OSP: an application in sensors Scanning Probes – Application Note 3
Latest updated: June 13, 2024Abstract
The response of the Scanning Electrochemical Microscope (SECM) depends on the surface conductivity of the sample as well as its topography, or more precisely the distance between the probe and the sample. In some cases where the sample is uneven or too rough, the change of response due to the topography is higher the change of response due to conductivity. Measurements in constant distance mode are then needed.
M370/M470 systems provide a way of performing constant distance measurements. First, the sample is scanned using the Optical Surface Profiler (OSP) technique, a laser-based profilometer. Second, the topography data are used in the SECM measurement to keep the probe at a constant distance from the sample. The note shows the procedure to do these measurements on a screen-printed sensor.
Introduction
Application of the scanning electrochemical microscopy (SECM) technique to sensors or electrodes can provide valuable information. Providing a high-resolution view of the sensor’s activity or conductivity across the surface of the sensor can help the development of higher sensitivity sensors with greater reproducibility. Key to the measurement of electrochemical activity using the SECM technique is the ability to maintain the SECM electrode in close and constant proximity to the surface during a scan as the current measured across a surface can be influenced by the topography and the electrochemical activity, producing a response that is a sum of both.
This may not be an issue for small areas, or for sensors that could be considered flat, however, for the sensors that:
- are not flat (e.g. screen-printed),
- cannot be levelled (e.g. delicate biological interface) or not precisely enough (e.g. large area sensors),
- have some masking or underlying tracking,
it may be necessary to remove the topology effect from the probe’s signal to access the true electrochemical activity over the surface.
With the addition of Height-Tracking, it is possible to effectively remove the effects of topography resulting in an unbiased measure of the electrochemical activity. In this application note the topography measurement is obtained using the OSP (Optical Sensor Profiler).
Method
The ability to relieve surface topology requires that an OSP and an SECM area scan can be aligned such that the measured areas are identical, and the probe height is changed in accordance with the surface features. This requires that an alignment is made with reference to a feature that is visible to both techniques.
In the following example (and in the example of the application note #1), two small screen- printed sensors are investigated by SECM using the Height-Tracking feature of the M370. The sensors areas are formed from conducting carbon inks with an underlying connective tracking.
In the first example, a sensor’s conductivity is imaged across the surface, and in the second example the variation in sensor activity under biased conditions is investigated. In both cases, an alignment mark is scanned initially, so that the topology can be accurately applied to the SECM probe tip in the second part of the experiment.
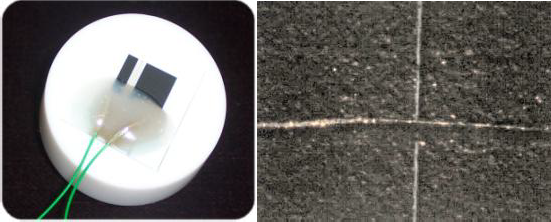
Figure 1 A) shows the screen-printed sensor mounted to a PTFE blank. The alignment mark in
B) is created with a sharp scalpel so that the deformation on the sample’s surface provides topology sufficient for both the OSP and SECM techniques to register. After finding the cross-hair centre position, all other scans can be referenced to that position.

Figure 1 : A) Screen-printed sensor mounted on PTFE blank B) Contrast-enhanced micrograph of alignment mark used to align OSP and SECM scans (image B is shown at a magnification of x200)
Results
OSP measurement
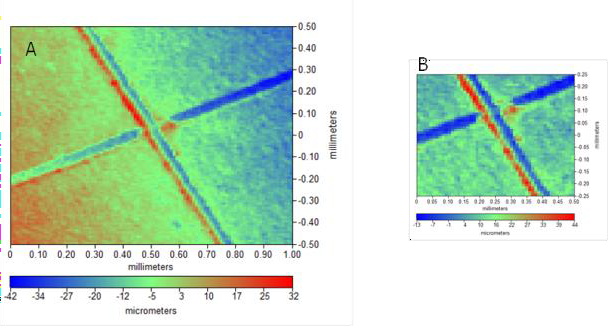
The OSP sensor head was connected to the M370 and arranged to detect the diffusely scattered laser radiation, and was configured in such a manner that an area scan would bound the cross- hair feature. OSP line-scans were then repeated in the X and Y axes and the sample was levelled by thumb screw after each line scan. After a number of scans the sample appeared level around the cross-hair feature, sufficient for a standard SECM experiment to take place after the OSP topology experiments had been concluded. Examples of the cross-hair measured prior to levelling and then again after levelling are shown in Fig. 2.

Figure 2 : OSP area scans (A) before and (B) after levelling the sample.
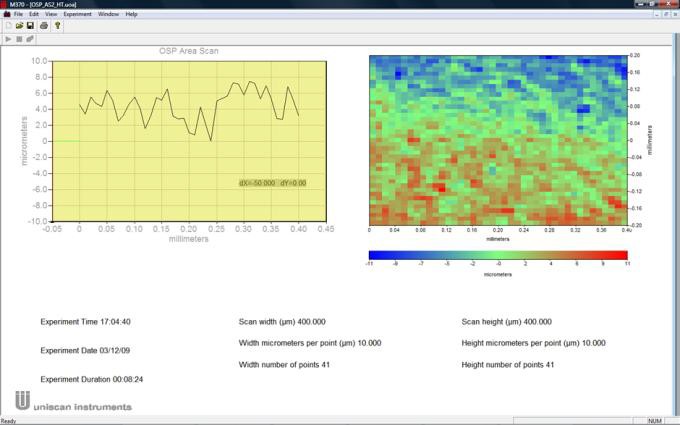
After locating the centre of the cross-hair, shown in Fig. 2, the OSP probe was moved to this central location and the scanning stage’s datum was set to zero. The OSP probe was then relocated from this position a distance of (x,y) = (0, 500) µm and again the datum was set to zero. A further OSP area scan was performed, the results of which are shown in Fig. 3. This result was then used to relieve the SECM probe position in a later experiment. It can be seen that The sensor surface has a noticeable tilt or recess of around 20 µm in depth towards the top of the sensor scan.

Figure 3 : Optical Surface Profile of a screen-printed sensor surface with 10 µm step size.
SECM alignment
The SECM experiments are to use a 10 µm SECM probe. This places a requirement on the accuracy of the vertical positioning of the probe to the electrode surface of approximately this dimension; if the probe to sample distance changes even to a minor extent, any positive or negative feedback that is detected (due to the interactions of the probe and the surface) will produce noticeable changes in the current.

Figure 4 : Approach curve to the screen printed surface.
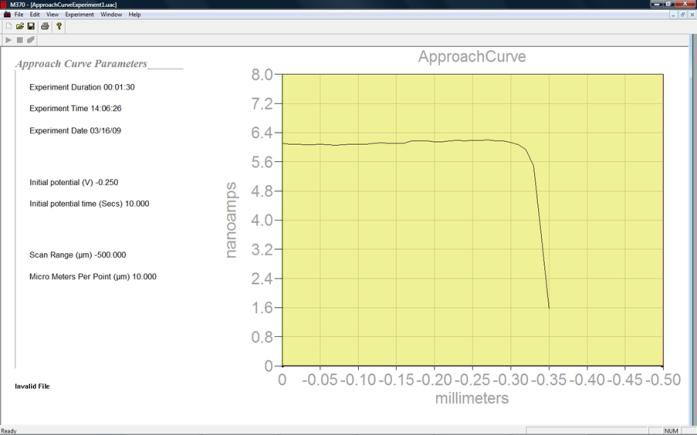
As can be seen in Fig. 4, when the probe is in close proximity to the electrode (20 – 30 µm), the mediator will become used up and a negative feedback effect will occur, resulting in a sharp drop in current. As the probe scans over the cross-hair feature, the raised edges of the cross- hair cause a further reduction in current allowing the imaging of the cross-hair feature in a negative-feedback mode. Figure 5 shows the end result of the SECM area scan over the cross-hair feature.

Figure 5. SECM area scan of the cross-hair feature shown in Fig. 2.
In the same manner as performed previously with the OSP head, the SECM probe is centred on the cross-hair and its datum is made zero. The probe is then retracted from the sample and repositioned at (x,y) = (0, 500) µm where the datum is again set to zero ready for the next area scan experiment. A new approach curve experiment is performed and the probe is positioned in close proximity to the sensor surface, such that the bulk current of approximately 6 nA is reduced to around 2.4 nA.
SECM measurement with topology relief.
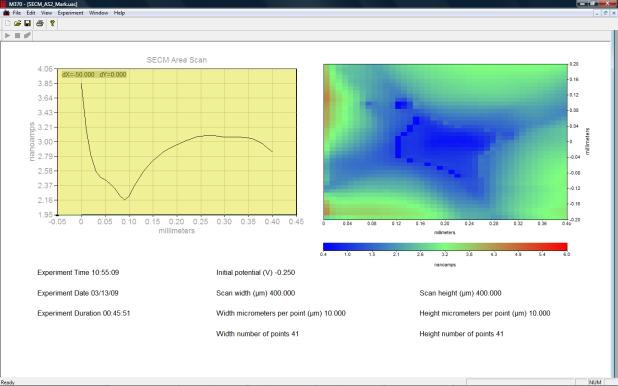
A new SECM area scan was configured to use the topology data from Fig. 3, having the same area size and step size. The conductivity of the surface was then measured using these values, the results of which are shown in Fig. 6.

Figure 6 : SECM area scan using height-tracking in negative feedback mode.
The constant value of current across the sensor surface in Fig. 6 is an indication of two things :
i) the sensor surface is relatively homogeneous in its conductivity, ii) the SECM probe has remained in close proximity to the surface over the whole scan. This can be taken as evidence that the probe is tracking the surface as intended.
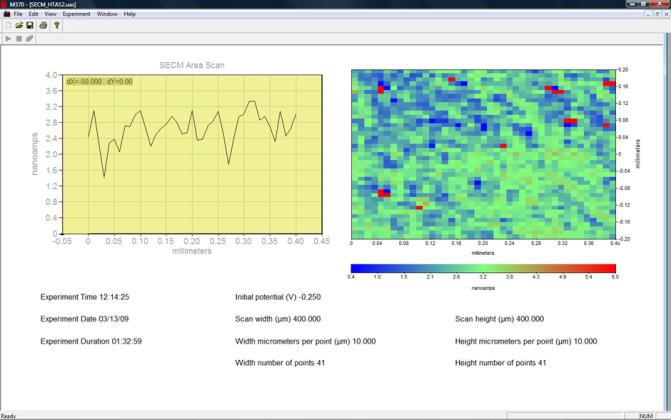
For the second SECM area scan on a second bio- sensor, it was biased at a potential that was just sufficient to produce a small reduction current as the Ferricyanide was reduced at the sensor (-0.1 V vs. Ag/AgCl). This potential was chosen to contrast the areas that were easily brought to an active (reductive) state across the sensor and those that were inactive. Figure 7 shows the results for the probe working in competition with the sample (i.e. biased at -0.25 V), where areas of low current indicate the sample is active and already reducing the mediator.

Figure 7: SECM area scan using height-tracking in competition mode.
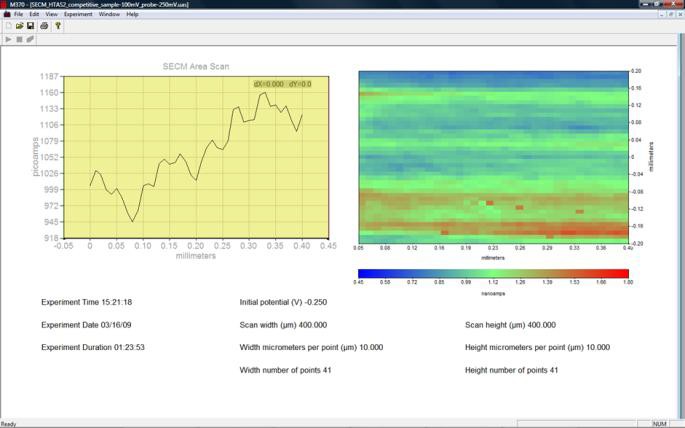
In Fig. 7, active areas across the screen-printed electrode are indicated by the low-current regions (blue). Competition mode gives more contrast than negative feedback mode.
Conclusion
A new method of obtaining topography-free electrochemical SECM images is demonstrated on a pair of screen-printed electrodes. This feature of the M370 allows a user to access the surface electrochemistry of samples that were previously impossible to measure using standard constant-height SECM area-scan techniques.
The combination of OSP and SECM techniques are demonstrated on a pair of screen printed carbon-ink sensors over 0.16 mm2 with topography variation of around 20 µm, while maintaining close probe-sample proximity. The experiments were performed on both biased and unbiased samples, and showed defined areas where the sensor was more active. The current variation measured over these areas varied between 450 pA to 1.8 nA.


