

SDS Reservoir Head Scanning Probes – Application Note 25
Latest updated: June 13, 2024In Scanning Droplet Cell (SDC) an electrochemical cell is formed in a droplet on the surface of the sample of interest. This droplet can be used to either image a sample or perform local electrochemical experiment at a feature of interest. In this application note the reservoir head, one of two SDC head types supplied with the SDS470, is introduced with three examples.
Introduction
Scanning Droplet Cell (SDC; also known as Scanning DropletSystem or SDS) is a microcell-based scanning probe electrochemistry technique. In SDC a droplet of electrolyte forms between the sample and a capillary head in close proximity to form the electrochemical cell. The sample acts as the working electrode, and the auxiliary electrodes are contained within the SDC head. The result is a two- or three- electrode cell on the scale of the droplet in contact with the sample. While standard electrochemical and impedance techniques can be performed within the droplet, it can also be raster scanned across the sample at a set dc bias or ac frequency to map its electrochemical properties.
As a direct local measurement of the sample SDC has the advantage that interpretation of the measurements is straightforward because bulk electrochemical principles can be directly applied. Furthermore, SDC is unique in that it only exposes a small, droplet sized area of the sample to the electrolyte at each measurement point, this is contrary to most other scanning probe electrochemistry techniques which require the entire area of interest to be immersed in electrolyte for the measurement to be performed. This feature makes SDC appealing for in situ measurements of samples which could be adversely affected by extended exposure times to the measurement electrolyte, for example those of interest in corrosion studies.
Because SDC allows localized direct electrochemical measurements it has found use in a number of fields including catalysis [1], corrosion [2], materials [3], and photovoltaics [4].
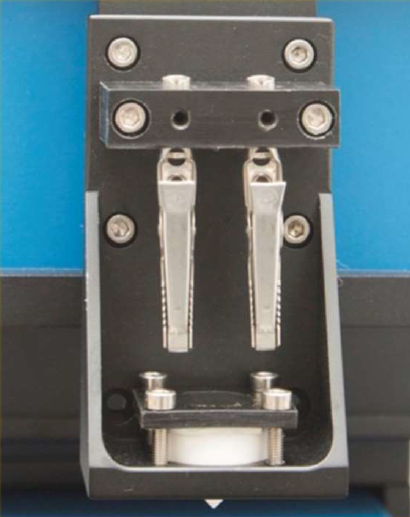
Both AC- and DC-SDC measurements can be made on the M470 using the SDS470 module. The SDS470 is supplied with both a flow head, in which electrolyte is continually refreshed during the measurement, and a reservoir head, which contains the electrolyte in a reservoir above the capillary opening. This head has a smaller tip opening, 100 µm, and is therefore a higher resolution option. The reservoir head is shown mounted on the M470 scan head in Fig. 2. In this note we will demonstrate the use of the reservoir head for SDC for three different samples.

Experimental
The SDS470 + SP-300 is used with the reservoir head to perform all measurements in this note. Tap water was used as the electrolyte for all measurements. In all cases the sample was used as the working electrode, and a single Pt wire was used as a combined RE/CE.
Three different samples were measured: (1) a trimetallic Cu/Zn/Fe sample, (2) the standard Fe/Zn Scanning Kelvin Probe (SKP) sample, and (3) a steel weld from the front suspension arm of a popular offroad vehicle. The trimetallic sample, and steel weld were potted in resin and polished flat. An electrical contact was made to the backside of all samples to allow their use as a working electrode. Further information on the preparation of the trimetallic sample can be found in SCANLab TN#3 [5]. In the case of the steel weld it was found that gaps between the steel plates, and between the steel and resin caused the droplet to lose contact with the sample, and disappear. To avoid this the steel weld was coated with beeswax which was then polished off leaving any gaps filled. Prior to use the trimetallic sample and steel weld were polished on wet P4000 silicon carbide paper and rinsed with deionized water.
In all cases the sample Open Circuit Potential (OCP; also known as Corrosion Potential or Ecorr) was measured at each point. Sweep scan was used for all measurements. The Cu/Zn/Fe sample was measured over a 9000 µm x 3000 µm area, with a 150 µm step size in both directions. A sweep velocity of 250 µm/s was used. The Fe/Zn sample was measured over a 2500 µm x 2500 µm area, with a step size of 50 µm in both x and y. The sweep rate was 500 µm/s. The steel weld was measured over a 2500 µm x 2300 µm area with a 50 µm step size in x and y. A sweep rate of 1000 µm/s was used.
All samples were mounted in the TriCell, with the glass body removed for easier access of the SDC head, and better observation of the droplet. The sample was then levelled using a circular spirit level. In all cases this resulted in a sample which was level enough over the planned scan area for the droplet to remain in contact with the sample throughout the measurement. To form the droplet the sample and head were viewed using the VCam3 long working distance video microscope, and the head was approached to within 50 µm or less of the sample surface. Pressure was applied to the cap of the SDC head to force solution out of the head forming the droplet. If the droplet welled out of the head this was wicked away with paper towel and the process repeated. Ideally the droplet is confined to the area directly under the tip, however the final droplet size is dependent on the sample and electrolyte used. Post processing of all area maps was performed using the Gwyddion software [6]
Results
1. Trimetallic sample
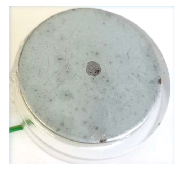
Fig. 3 shows the trimetallic Cu/Zn/Fe sample measured with the SDC reservoir head. The sample was oriented for the measurement so moving in the +x direction the head measured the OCP of Cu, Zn, and finally Fe. From the map shown in Fig. 4 the corrosion potential varies in the order Zn < Fe Cu as expected.
 Figure 3: The Cu/Zn/Fe trimetallic sample is shown.
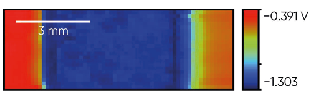
2. SKP sample
Fig. 5 shows the standard SKP sample measured using the SDC reservoir head. This sample is a Zn coated Fe plate, where the underlying Fe is revealed by acid etching. The Zn coating on this particular sample is inhomogeneous, with darker spots across the surface. The OCP measurement, which was performed across the sample from Fe to Zn, is shown in Fig. 6. The corrosion potential is seen to change in the order Zn < Fe with some inhomogeneity in the OCP of the Zn region seen.

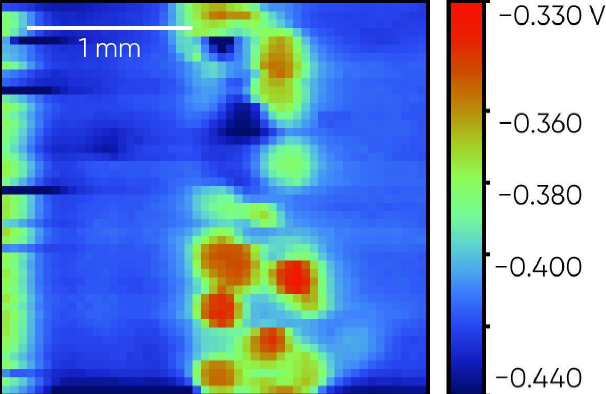
3. Weld sample
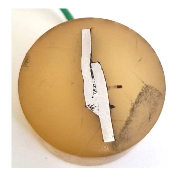
The steel weld sample is shown in Fig. 7. The OCP SDC measurement was performed across the central region of the sample so both steel plates, and the central weld were measured. The region measured was above the top black line on the resin in the picture. The resulting OCP SDC measurement is shown in Fig. 8. Notice in this measurement the islands of the weld have a higher corrosion potential than the steel plates either side. Within the left-hand plate there also exists a small higher corrosion potential region.
Conclusion
Three samples have been used to demonstrate the use of the SDC reservoir head. Using the SDC measurement it has been possible to directly measure the local OCP of the samples, in situ. This is a particular advantage over other scanning probe electrochemical tec niques which are either an indirect measure, are performed ex situ, and/or require calibration to determine the OCP.
References
1. B. H. Meekins, A. B. Thompson, V. Gopal, B. A. Tavakoli Mehrabadi, M. C. Elvington, P. Ganesan, T. A. Newhouse- Illige, A. W. Shepard, L. E. Scipioni, J. A. Greer, J. C. Weiss, J. W. Weidner, H. R. Colón-Mercado, Int. J. Hydrog. Energy, 45 (2020) 1940-1947
2. J. M. Thuss, J. R. Kish, J. R. McDermid, Magnesium Technology 2012 (2012) 403-409
3. J. Gasiorowski, A. I. Mardare, N. S. Sariciftci, A. W. Hassel, J. Electroanal. Chem. 691 (2013) 77-82
4. J. P. Kollender, J. Gasiorowski, N. S.Sariciftci, A. I. Mardare, A. W. Hassel, Sci. Technol. Adv. Mater. 15 (2014) 054201
5. SCAN-Lab Technical Note #3 “Relating Work Function Difference Measured by Scanning Kelvin Probe (SKP) to Corrosion Potential”
6. Gwyddion data analysis software http://gwyddion.net/
Revised in 08/2021


