

Fuel Cell Testing Part I: Overview and I/E characterizations (IV characterization) Fuel-Cell – Application Note 31
Latest updated: July 28, 2023Abstract
A Fuel cell is an electrochemical energy conversion device converting chemical energy (fuel) into electrical energy. The overall performance of this device can be characterized by a fuel cell tester.
In this note, a single Proton Exchange Membrane Fuel Cell (PEMFC) was characterized using FCT-150 Fuel cell tester. Electrochemical tests, gas (H2 and O2), water management, and heating on the anodic and the cathodic side of the fuel cell were performed using FC-Lab software.
The characterization of the electrochemical performance of a commercial polymer membrane was done using linear polarization and current pulse techniques.
Introduction
The fuel cell is defined as a device which produces electricity from fuel and oxidant. Fuel is provided at the anode and oxidant at the cathode. Unlike batteries, fuel cells can work continuously as long as they are provided with fuel and oxidant (no electrical charge is required after discharge). Several types of fuel cell exist such as alkaline fuel cell, direct methanol fuel cell, phosphoric acid fuel cell, and proton exchange membrane fuel cell (PEMFC) [1,2]. PEMFC exhibits better performance at low temperature than the others, hence significant research has been carried out on such devices. PEMFC works follows:
- anode (hydrogen oxidation, Fig. 1 eq 1),
- cathode (oxygen reduction, Fig. 1 eq 2),
- membrane allowing proton exchange between both sides.

Figure 1: PEMFC principle.

Regarding fuel cell testing, a key issue is gas (specially gas temperature and humidity) and water management. These parameters are critical for reaching the optimal fuel cell performance.
The purpose of this application note is to present the capabilities of the FCT series monitored by FC-Lab® software. This combination of hardware and software allows users to control gas, temperature, water and load boxes with high current ability (up to 150 A). Electrochemical Impedance Spectroscopy (EIS) will be discussed in another application note [3].
Set-up description
For this application note, FCT-150S with automatic humidifier water filling and condenser purging option was used. The FCT 150S was monitored by FC-Lab® software. The FCT-150S was connected to a fuel cell using the two-electrode connection (blue and white leads on the anode; red lead on the cathode).
The surface area of the fuel cell is 25 (if no indication) or 50 cm2 (Fig. 2).

Figure 2: Fuel cell.

Gas and water management
Presentation
As previously stated, a key issue for fuel cell testing concerns gas and water parameters such as gas flow, gas & water temperature, gas humidity, humidifier filling and condenser purge. These parameters are defined in the “Gas” tab (Fig. 3). In the block named “Cell”, cell size, cell temperature and purge flow are set. The following three blocks deal with the supplied gas. Fuel cell can be feed by several gas combination such as H2 and O2, H2 and Air or any other anodic gas (AG) and cathodic gas (CG). In the latter combination, users can adjust the H2 and O2 ratio. The flow, humidifier temperature, line temperature of anodic or cathodic gas all have to be set in their respective block.
Note that stoichiometric (“stoichio”) mode can be selected via a combo box. If “stoichio” mode is chosen, users can adjust the stoichiometric coefficient for each gas.
Note the “Humidifier automatic filling” box has to be checked to activate this feature (Fig. 3).
Gas and water management data are stored in the “*.log” format file.

Figure 3: “Gas” window.

A global view of the gas and water management parameters is summarized in the “Synopsis” tab (Fig. 4).

Figure 4: Synopsis tab.

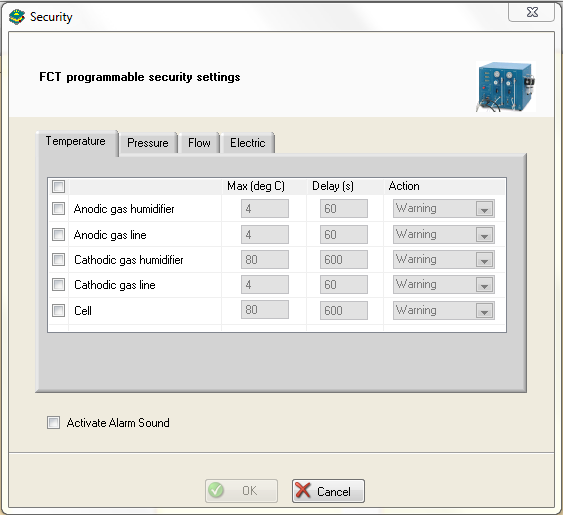
Safety parameters
To ensure safe investigations, temperature, pressure, flow, current or potential can be used as safety parameters in the “Security” window (Fig. 5).

Figure 5: Security window (example is given with Temperature tab).
Humidity calculator tool
Gas humidity strongly affects fuel cell performance. That’s why, in order to optimize fuel cell performance, FC-Lab® software enables the user to calculate the optimal humidity condition through the “Humidity Calculator” tool (Fig. 6) available in the “Help” menu of FC-Lab®.

Figure 6: Humidity Calculator window.

Characterizations
To illustrate common fuel cell investigations, current polarization and pulses measurements are shown in this paragraph.
Polarization
Polarization is performed at low current scan rates (few mA·cm-2) from zero current to a limit value of potential, defined as Ewe Emin. Parameters are described in Fig. 7.

Figure 7: Polarization technique parameters window.

Resulting curves of E and P vs. current density (i) are displayed in Fig. 8.
Power is defined as follows:
$$P_i=E_iI_i \tag{1}$$
where P is the power, E the potential and I the current.
This E vs. I curve is usually divided in three regions [2]:
- Activation polarization: from 0 to 100 mA·cm-2 (Fig. 8) in which reaction rate loss dominates,
- Ohmic polarization: from 100 to 600 mA·cm-2 (Fig. 8) in which ohmic drop dominates,
- Concentration polarization: from 600 mA·cm-2 to the end (Fig. 8) in which mass transfer dominates.
The fuel cell power vs. current can be plotted. In the example given in bottom of Fig. 8, the maximum power is 6.5 W and this maximum power is reached at 580 mA·cm-2.

Figure 8: E (top) and P (bottom) vs. current density polarization curves.

Current pulse
In order to investigate fuel cell performance a discrete current ramp can be applied. Two examples are given below. The first one illustrates the high current ability of the load box and the second one shows a long-term experiment.
a. High current
Successive current pulses of 60 s are applied to the fuel cell by step of 10 A (Fig. 9). In the first step, 10 A are applied, in the second 20 A and so on up to 100 A. Note that this experiment is carried out on a fuel cell with a surface area of 50 cm2.

Figure 9: Current pulse technique parameters window.

The resulting chronopotentiometric curve is displayed in Fig. 10.
Figure 10: Chronopotentiometric curve.

b. Long term
Automatic gas and water managements allows users to perform long term measurements (thousands of hours). A current pulse technique with a current intensity of 4, 5 and 2 A was performed over 60 h. The resulting chronopotentiometric curve (Fig. 11) shows the stability of the fuel cell potential during the experiment.
Figure 11: Long term chronopotentiometric curve.

Conclusion
This note demonstrates the benefits of the highly compact FCT series range with FC-Lab® monitoring software. This combination of hardware and software makes it possible to control the fluidic parts (gas and water) and electro-chemical part (control and measure of current and potential) of the fuel cell testing with the same system.
Data files can be found in :
C:\Users\xxx\Documents\EC-Lab\Data\Samples\Battery\AN31-32_Manip
References
1) J. Larminie, A. Dicks, Fuel Cell Systems Explained, Wiley, Chichester (2003).
2) H. R. Kunz, J. M. Fenton, The Electrochem. Soc. Interface, Fall (2004) 17.
3) Application Note #32 “Fuel Cell Testing, Part II: EIS characterization”
Revised in 08/2019
Added in 04/2023


