

Fuel Cell Testing Part II: EIS characterization (EIS characterization) Fuel-Cell – Application Note 32
Latest updated: July 31, 2023Abstract
The Impedance technique is a powerful tool for investigating the mechanisms of electrochemical reactions occurring on the proton exchange membrane.
In this note, an EIS investigation on a 25 cm2 PEMFC membrane was performed. Impedance settings and the obtained impedance diagrams were presented. The kinetic and the ohmic properties of the membrane were determined using Equivalent circuit Fitting algorithm (Z Fit) available in EC-lab software. The evolution of membrane resistance, charge transfer resistance and mass transport resistance obtained under variable current densities were also studied.
Introduction
Electrochemical Impedance Spectroscopy (EIS) investigations are used intensively to complete fuel cell characterizations carried out with common electrochemical techniques (scan or pulse of current or of potential). [1], This can lead to additional information [2-4] such as:
- reactivity and structure of the interface,
- electrochemical reactions and mass transport limitation.
The aim of this note is to demonstrate the benefits of the FC-Lab® and FCT series combination for EIS measurements and to analyze EIS data with Zfit (EIS modeling tool) included in EC-Lab® software.
Set-up description
FCT-150S with impedance and automatic water control was used and was monitored by FC-Lab®. The FCT-150S was connected to a fuel cell with the standard two-electrode connection (blue and white leads on the anode and the red lead on the cathode). The surface area of the fuel cell was 25 cm-2.
Impedance characterization
Standard impedance techniques (potentiostatic and galvanostatic) are available in the FCT system controlled by FC-Lab®. In this note the macro techniques (several linked techniques) of FC-Lab® are highlighted, especially Staircase Galvanostatic Electrochemical Impedance Spectroscopy measurement (SGEIS).
SGEIS technique includes a scan of current with several GEIS experiments along the current scan. SGEIS settings are shown in Fig. 1.

Figure 1: SGEIS macro-technique window.
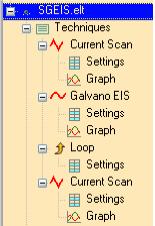
Figure 2 displays only the GEIS settings (more information on current scan settings are given in the previous note [1]). Settings are divided in two blocks. In the first one, the bias current is set. In our example, the box “vs. init” is ticked in order to perform EIS measurement at the current where the scan was stopped at the former loop. In the second block, frequencies scan (between Fi and Ff) and the intensity of the modulation (Ia) are defined. In our case, the scan is carried between 1 kHz and 100 mHz with an amplitude of 1 A.

Figure 2: GEIS technique parameters window.

Current scan is displayed in Fig. 3 and the locations of the EIS measurements are indicated with red arrows.

Figure 3: Current scan during SGEIS macro technique. Red arrows show where GEIS experiments are performed.

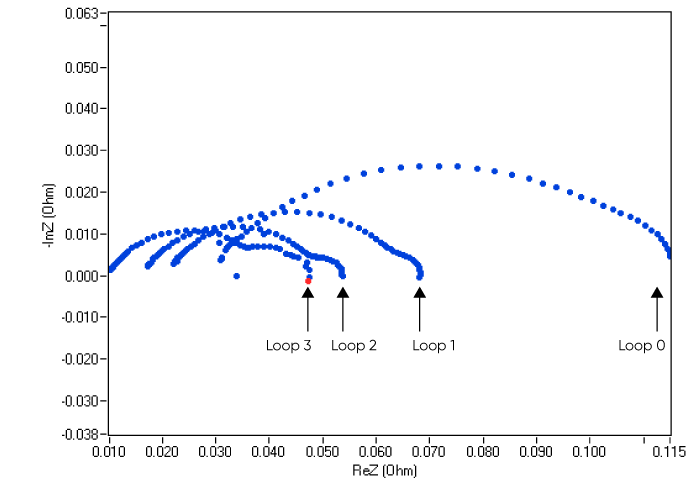
The resulting data are displayed as Nyquist plot in Fig. 4.

Figure 4: Nyquist plots resulting of GEIS measurements. For clarity, only the loop # 0; 1; 2 and 7 are displayed.
The Nyquist plot can be plotted in 3D by ticking the 3D box (Fig. 5). In this plot, the z-axis corresponds to the loop number.
EIS data fitting

Figure 5: 3D Nyquist plots.

FC-Lab® data (which are stored in “*.elt” format; Electrochemical Text) have to be exported into EC-Lab® software in order to be fitted with Zfit. The export procedure is described in the first part of the next paragraph. Fit process and result analysis are discussed in the second part.
Data importation from FC-Lab® to EC-Lab®
The import procedure is the following:
- in the “Experiment” menu, select “Import From Text” (Fig. 6),
- load the “*.elt” file of interest,
- in the block “Importation Parameters”, select FC-Lab® data in the “Text File format” combo box,
- in the “Importation” block, click on “Import” to create the “*.mpr” file,
- then, the resulting “*.mpr” file can be opened with EC-Lab®.
Note that it is also possible to import “*.log” file into EC-Lab®. This file contains gas pressure and temperature, potential of the cell.

Figure 6: Import From Text window.

ZFIT
As the Nyquist plots (Fig. 7) display two capacitive arcs at frequency of 20 and 0.5 Hz, the fit is performed with the following equivalent circuit R1+R2/C2+R3/C3. Other equivalent circuits can be relevant for example R+R/C+C/Wδ as done in [3] with WWδ: Warburg element for convective diffusion.

Figure 7: The two capacitive arc at 20 and 0.5 Hz.

Table I displays the fitted resistance values. Further information about ZFit is available in EC-Lab® manual or in the application note #14 [5].
Table I: ZFit results.
| Loop | i/mA·cm-2 | R1/mΩ | R2/mΩ | R3/mΩ |
|---|---|---|---|---|
| 0 | 39 | 21.63 | 53.26 | 12.19 |
| 1 | 76 | 19.14 | 46.58 | 10.87 |
| 2 | 114 | 16.43 | 32.75 | 8.76 |
| 3 | 152 | 13.69 | 28.54 | 8.42 |
| 4 | 189 | 11.36 | 29.60 | 9.70 |
| 5 | 227 | 11.34 | 29.46 | 10.56 |
| 6 | 264 | 9.99 | 28.38 | 12.43 |
| 7 | 302 | 10.02 | 30.42 | 13.80 |
a. Contact resistance
The contact resistance, called R1, is due to the graphite plate, contact resistance, wires. Fig. 8 displays the change of this resistance versus the current density along the measurement. The schematic indicates that R1 decreases when current density increases. When the fuel cell is working, water is produced. Then, this water production leads to an improvement of fuel cell performance. This behavior was already reported in the literature [3].

Figure 8: R1 vs. current density.

b. Mass transfer
Diagram R3/(R2+R3) = f(i) (Fig. 9) exhibits a constant slope beyond 50 mA·cm-2. This behavior shows that the mass transfer contribution changes proportionally to the current [1].

Figure 9: R3/(R2+R3) vs. potential.

Conclusion
This note deals with EIS investigations on fuel cells. The first part describes the macro technique, named SGEIS. This protocol allows users to automatically perform successive EIS measurements along a current scan. The second part is focused on EIS data analysis. The compatibility between FC-Lab® and EC-Lab® software makes the EIS analysis easy to implement. This allows users to determine some characteristic parameters of the fuel cell, for example contact resistance, mass transfer, …
Data files can be found in :
C:\Users\xxx\Documents\EC-Lab\Data\Samples\Battery\AN31-32_Manip
References
1) Application Note #31 “Fuel Cell Testing, Part I: Overview and I/E characterizations”
2) E. Barsoukov, J.R. Macdonald, Impedance spectroscopy. Theory, Experiment, and Applications., Wiley, Hoboken, USA (2005).
3) J.-M Le Canut, R. Latham, W. Mérida, D.A. Harrington, J. of Power Sources, 192 (2009) 457.
4) J.-P Diard, B. Le Gorrec, C. Montella, C. Poinsignon, G. Vitter, J. of Power Sources, 74 (1998) 244.
5) Application Note #14 “ZFit and equivalent electrical circuits”
Revised in 08/2019


