

Calculation of the active surface of platinum (Fuel cell ECSA) Application Note 11
Latest updated: July 1, 2025Abstract
The state of the surface of an electrode can be very important depending on the experiment carried out. It should always be as smooth as possible to avoid parasite reactions. In the proper conditions, characteristic values can be determined such as the number of adsorption sites per surface unit for a given material.
In this application note, the active surface area of a Pt electrode is determined from a CV measurement using hydrogen underpotential deposition (HUPD).
Introduction
The state of surface of an electrode can be very important depending on the experiment carried out. It should always be as clean as possible to avoid parasitic reactions. It should also be, according to the electrode’s geometry, as smooth as possible. For example, in the case of a planar electrode, the surface should be as plane as possible on a microscopic scale. In the proper conditions, characteristic values can be determined such as the number of adsorption sites per surface unit for a given material.
The aim of this tutorial is to show the user how to determine the active surface of an electrode from a voltammetric curve giving I vs. EWE.
Experimental Conditions
- Working electrode: RDE (Rotating Disk Electrode) of platinum, working area: 0.0314 cm2,
- Counter electrode: Platinum wire,
- Reference electrode: Saturated Calomel Electrode,
- Solution: H2SO4 (0.25 M).
Protocol Description
The working electrode was polished with alumina and then rinsed with methanol and distilled water.
The solution was degassed with argon and agitated (Ω = 4000 rpm) for 15 minutes before launching the experiment. During the measurement, the electrode rotation was stopped.
The technique used under EC-Lab® was Cyclic Voltammetry. The parameters settings are described in Figure 1.
Please note: the adjustment of the E Range and then an increase of the potential control resolution (span) can be important. For this experiment, the E Range was adjusted between [-5; 5] V and then the minimum potential step height from 300 to 200 μV [1].
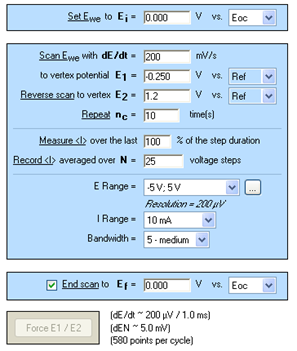
Figure 1: Cyclic Voltammetry “Parameters Settings” window.
The curve obtained is displayed in Figure 2, and its shape is comparable to those found in literature [2]. The related data file was processed to separate the different cycles of the curve.
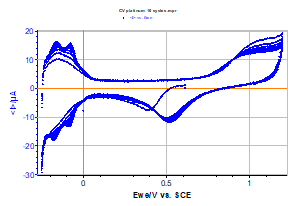
Figure 2: Voltammetric curve I vs. EWE obtained by cyclic voltammetry (10 full cycles) for platinum in an acid solution.
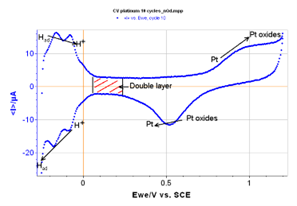
Figure 3: 10th cycle isolated from the curve with redox specificities for platinum.
Calculation of the Active Surface
During the reduction of platinum, protons from the acid are adsorbed at the surface of the electrode. During the oxidation, these hydrogen atoms are desorbed according to the following electrochemical reaction:
$$\text H_\text {ad}\rightarrow \text H^+ + e^- \tag{1}$$
The measurement of the number of electrons liberated during the oxidation of platinum for low potentials gives the number of hydrogen atoms desorbed and thus the number of adsorption sites present on the electrode’s surface. This defines the active surface of the electrode.
The total charge corresponding to hydrogen desorption can be related to the integral of the curve for a certain interval of potentials where the atoms are being desorbed. This part of the curve is presented in Figure 4.
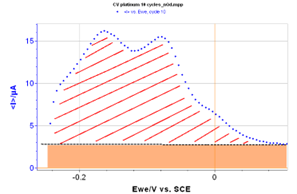
Figure 4: Zoom of the curve presented in Figure 3 for low potentials in oxidation. The red area corresponds to the desorption of hydrogen. The orange area corresponds to the capacitive current due to the double layer capacitance.
The expression of the total charge of desorption can be written as follows:
$$Q = \int_{t_1}^{t_2}{I·d\tau} = \frac{1}{\nu_\text b}\int_{E_1}^{E_2}{I·dE} \tag{2}$$
where vb is the scan rate. This integral can be calculated with EC-Lab’s® Integral graph tool. However, the capacitive current, due to the double layer capacitance, should not be taken into account, and the corresponding area must be subtracted from the integral calculated by EC‑Lab®.
EC-Lab’s® Integral graph tool gives the following result (Fig. 5):
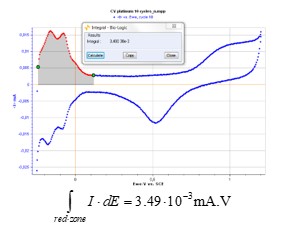
Figure 5: EC-Lab® integral analysis tool.
$$\int \limits_{red-zone}{I·dE} = 3.49·10^{-3}\,mA·V \tag{3}$$
The area must be calculated manually, due to the double layer. If the capacitive current is constant for all potentials, it simply needs to be multiplied by the length of the potential interval used for the integral.
In this experiment, the capacitive current value is 2 μA and stays constant for the potential interval considered (340 mV).
The area corresponding to the double layer equals:
$$2·10^{-3}·0.34 = 6.8·10^{-4}\,mA·V$$
Therefore the area corresponding to the desorption equals:
$$(3.49-0.68)·10^{-3} = 2.81·10^{-3}\,mA·V$$
To have the charge value for the desorption of hydrogen, the previous result needs to be divided by the scan rate vb, and to obtain the charge value per surface unit, the new result needs to be divided by the electrode surface.
$$2.81/0.2 = 14.05 \,\mathrm{\mu C}$$
$$Q = 14.05/0.0314 = 447 \,\mathrm{\mu C·cm^{-2}}$$
In literature, the electrical charge generally associated with mono-layer adsorption of hydrogen is 210 μC·cm-2 [3]. The result found previously is higher, but it can be explained. The theoretical value is for a planer surface of the electrode. Although the working electrode was polished before this experiment, a good microscope would show that the surface is not totally planer and consequently that the surface area is larger than in theory. This means there would be more adsorption sites for the hydrogen atoms, which can partly explain the experimental results obtained.
Note: the number of protons absorbed and thus the number of adsorption sites can be determined by dividing the final result with the charge of a proton (1.6·10-19 C).
Conclusion
In this note, we have shown how to determine the active surface of an electrode from a voltammetric curve by using EC-Lab® software.
References
- Technical Note #8 “Adjustment of the potential control resolution”
- M. Chatenet, M. Aurousseau, R. Durand, and F. Andolfatto, J. Electrochem. Soc. 150 (3) (2003) D47.
- S.A. Sheppard, S.A. Campbell, J.R. Smith, G.W. Lloyd, T.R. Ralph, and F.C. Walsh, Analyst, 123 (1998) 1923.
Revised in 07/2018


