

In situ measurements for shrinking/dilation in energy storage devices during cycling Battery – Application Note 46
Latest updated: January 12, 2024Abstract
In this application note, we report the charge-induced dilation of a Li-Ion battery measured by means of a dilatometer during a battery cycling experiment controlled by a BioLogic potentiostat/galvanostat. The coupling of the dilatometer and the potentiostat/galvanostat allows the user to perform an in situ measurement during a battery cycling.
Introduction
It is well known that many Li-ion battery materials expand during lithiation, and shrink during de-lithiation. LiCoO2 is a prominent exception to this rule.
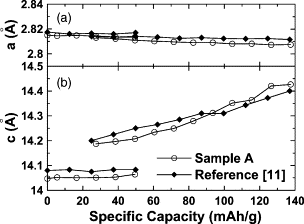
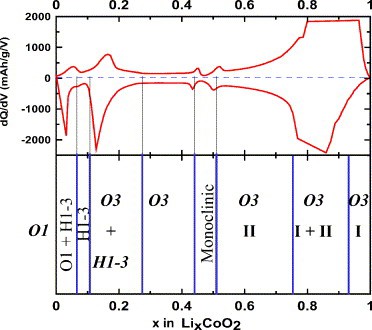
LiCoO2 consists of layers of monovalent lithium cations (Li+) that lie between extended anionic sheets of cobalt and oxygen atoms, arranged as edge-sharing octahedra. Lithium ions can be reversibly inserted into this structure in the potential range 3.0 to 4.3 V corresponding to x varying between 1 and about 0.5 in the formula LixCoO2, and the capacity varying between 0 and 140 mAh/g. In this reversible potential range, the interlayer distance along the c-axis continuously decreases during lithium insertion as shown by in situ XRD [1, 2]. At above 4.5 V, the lithium ions undergo an order-disorder transition coupled to a change in the crystal lattice to a metastable (O1) state. This transition as well as the excessive SEI growth already beginning at 4.3 V are considered to induce capacity fading at elevated potentials [1, 2] (Fig. 1 & 2).

Figure 1: (a) The lattice constants, a and c, measured from the XRD patterns collected during the first charge. The measurements were made on ZrO2-coated LiCoO2 (sample A) from [1]. (b) Data for un-coated LiCoO2 from [2].
The shrinking & dilation measurement during battery cycling is helpful for battery development. This method can also be applied to super capacitor testing.

Figure 2: (top) Differential capacity vs. Li concentration in LixCoO2; (bottom) phase diagram of LixCoO2 developed from dq/dV vs. diagram and in situ XRD measurements from [1].
In this application note, we report the charge-induced dilation of a LiCoO2 electrode measured with ECD-nano-DL from EL-CELL and controlled by a BioLogic potentiostat/galvanostat. The set-up is described first, followed by the resulting measurements.
Set-up description
Measurements are performed on a three-electrode cell. The electrodes and electrolyte are:
- LiCoO2 electrode with a diameter of 9 mm and 80 µm thick on Aluminum foil.
- Lithium metal for both counter and reference electrode.
- LiClO4 salt (1 mol/L) in Ethylene Carbonate and Dimethyl Carbonate (EC/DMC) with ratio of 1/1 as electrolyte.
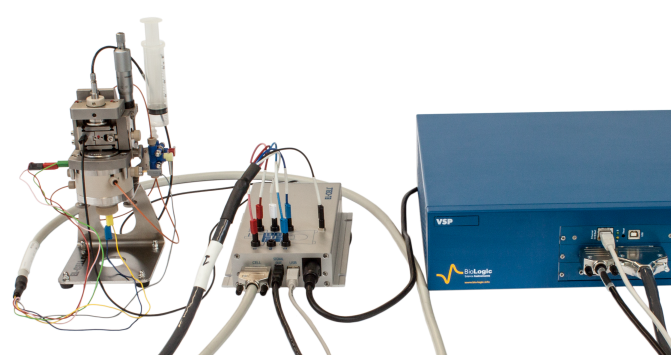
The outputs of dilatometer data logger are connected to the analog inputs of the VSP instrument (Fig. 3).

Figure 3: Picture of the setup. Dilatometer (left), Data logger (center) & VSP (right).
The five leads of the cell cable are plugged into dilatometer data logger box as shown in Fig. 4.

Figure 4: Cell cable connected to the data logger box.

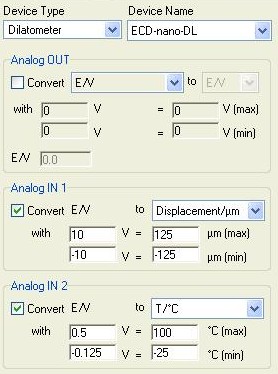
The dilatometer and electrochemical data are recorded directly by EC-Lab® (no need to synchronize two software interfaces). The “External Devices” window has been configured as follows (Fig. 5):
- Select “Dilatometer” in the “Device Type” combo box.
- Select “ECD-nano-DL” in the “Device Name” drop box.
The settings of the device are already set by default.

Figure 5: ECD-nano-DL Dilatometer configuration in the “External Devices” window.
Note:
ECD-nano-DL operated in 250 µm (i.e. +/- 125 µm) displacement range. Displacement range of 100 µm is also available with the ECD-nano-DL.
Measurements
The cycling of a LiCoO2 cathode based battery is performed at 200 µA in a potential window of 2.0 to 4.6 V. No floating period is set. The settings of the GCPL technique are shown in Fig. 6.

Figure 6: GCPL settings. Only the charge is shown in the screenshot.
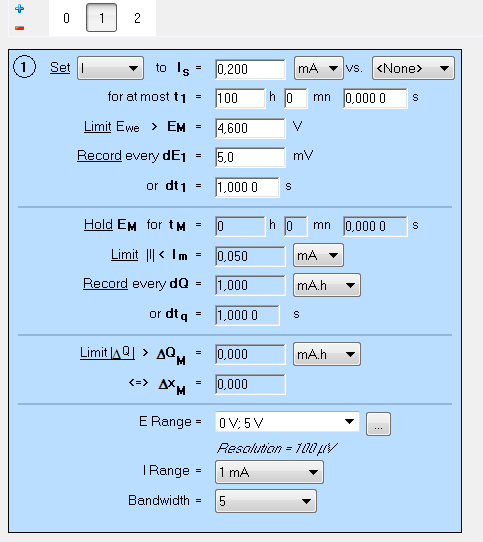
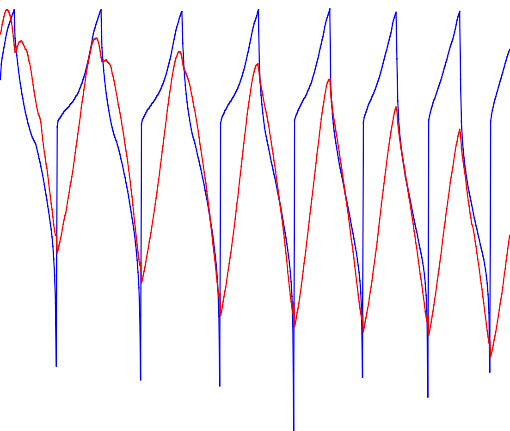
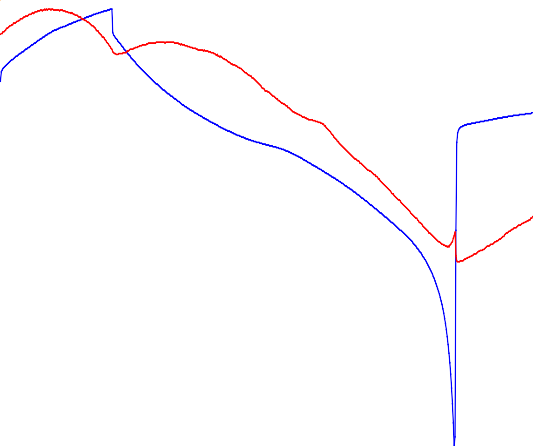
Figure 7 shows the LiCoO2 electrode dilation over seven successive cycles. As expected with the in situ XRD results [1], the dilation curve clearly shows an anomalous expansion during delithiation. Furthermore, the reported phase transitions close to the vertex points of the electrochemical cycle can be clearly seen. The phase transition at the upper vertex point at around 4.5 V fades out during cycling.


Figure 7: Electrode potential and dilation evolution during constant current cycling of a LiCoO2 electrode. Bottom: focus on the phase transitions at the two vertex points and at the first discharge midpoint.
Conclusion
This note presents how to connect the dilatometer and potentiostat/galvanostat together and perform an in situ dilation measurement during battery cycling. The configuration of the EC-Lab® software is also described. It is noteworthy that similar measurements can be carried out on supercapacitors.
These coupled measurements are complementary to other characterizations such as X-ray measurements.
References
1) Z. Chen, J. R. Dahn, Electrochim. Acta, 49(7) (2004) 1079.
2) J. N. Reimers, J. R. Dahn, J. Electrochem. Soc. 139(8) (1992) 2091.
Revised in 08/2019


