

Supercapacitors investigations Part I: Charge/discharge cycling (DC characterization) Supercapacitor – Application Note 33
Latest updated: July 31, 2023Abstract
Supercapacitors are energy storage devices providing high power densities with a quick charge-discharge regime. Their characteristics can be determined using many electrochemical protocols: cyclic voltammetry, constant current charge/discharge method, and Impedance method.
In this application note, the capacitance of an Electrical Double-layer Capacitor (EDLC) was measured using cyclic voltammetry. The energy density versus power density (Ragone plot) of the supercapacitor was plotted using constant power discharge technique.
Introduction
Among all the systems dedicated to energy storage, supercapacitors are one of the most promising, especially for powering electronic devices. This application requires an energy storage device able to provide many charges/discharges and short term pulses (a typical shape of current pulses is displayed in Fig. 1). These requirements are in agreement with the intrinsic characteristics of the supercapacitor.
![Typical pulse output requirement for a digital communication device from ref [1].](data:image/svg+xml;base64,PHN2ZyB4bWxucz0iaHR0cDovL3d3dy53My5vcmcvMjAwMC9zdmciIHdpZHRoPSI1MDAiIGhlaWdodD0iMzM4IiB2aWV3Qm94PSIwIDAgNTAwIDMzOCI+PHJlY3Qgd2lkdGg9IjEwMCUiIGhlaWdodD0iMTAwJSIgc3R5bGU9ImZpbGw6I2NmZDRkYjtmaWxsLW9wYWNpdHk6IDAuMTsiLz48L3N2Zz4=)
Figure 1: Typical pulse output requirement for a digital communication device from ref [1].
![Typical pulse output requirement for a digital communication device from ref [1].](https://biologic.net/wp-content/uploads/2019/08/an33f1.jpg)
The capacitor is made of one anode and one cathode separated by a dielectric membrane (Fig. 2). The capacitor is called a super-capacitor when the capacity is higher than 1 F

Figure 2: Sketch of supercapacitor.

In this note, the charge/discharge behavior of supercapacitors is investigated. Firstly, successsive charges/discharges are carried out with a potential scan. In the second part of this note we deal with discharge at constant power.
Set-up description
Investigations are performed with a VMP3 equipped with a standard board. The characteristics of supercapacitors are described below:
- capacity: 22 F
- maximum operating voltage: 2.3 V
- mass of active material: ~10g
The Supercapacitor is connected to a VMP3 via a standard 2-electrode connection.
Charge/discharge cycling
As stated above, one of the most important characteristics of an energy storage device is the ability of the device to be charged and discharged many times without any performance loss.
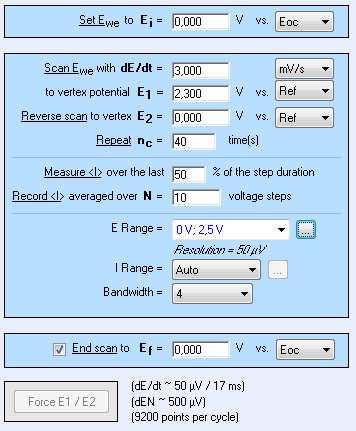
In this paragraph, charge/discharge characterizations are carried out by potentio-dynamic sweep at slow scan rate. The cycling of the supercapacitor is performed with 41 cycles of Cyclic Voltammetry (CV). at 3 mV/s between 0 and 2.3 V (Fig. 3).

Figure 3: CV settings window.
I vs. E and C vs. E curves are plotted in Fig. 4. These curves show that the current and capacity are stable over 41 cycles. The cycling does not affect the performance of the supercapacitor.
Note: C vs. E curve is plotted thank to the graphic customization ability of EC-Lab®:
$$C=i \frac{dt}{dE} \tag{1}$$

Figure 4: Charge/discharge cycling.

Constant power discharge
Energy storage devices are commonly represented by a Ragone plot i.e. E vs. P. This diagram can be plotted from Constant Power Discharge (CPW) data after mathematical treatment.
The settings of the CPW technique applied to the supercapacitor are described in Fig. 5. The following constant power steps are successively applied to the system: 200, 100, 50, 20, 10, 5 and 1 mW. The plot of Power vs. Energy is shown in Fig. 6.

Figure 5: CPW settings window.


Figure 6: Power vs. Energy plot.

The analysis tool « Constant Power protocol summary » (Fig. 7) allows user to calculate the energy and potentials and currents at the beginning and at the end of each power step. For this supercapacitor, this energy is around 10 mW/h.

Figure 7: CPW protocol result.

Finally from these calculated values the Ragone diagram can be plotted (Fig. 8).

Figure 8: Ragone plot.

Conclusion
Thank to these potentiodynamic and constant power discharges, it is possible to characterize the cycling performance of the supercapacitor. These characterizations allow users to determine if the supercapacitor being studied fits the need (according to its corresponding pulse output) of the electronic device to be powered.
The determination of the time constant is shown and discussed in the following application note [2].
Data files can be found in :
C:\Users\xxx\Documents\EC-Lab\Data\Samples\Supercapacitor\technique_supercap
References
1) R. A. Huggins, Solid State Ionics, 13 (2000) 179.
2) Application note #34 “Supercapacitors investigations. Part II: time constant determination”
Revised in 08/2019


