

Advantages of the intermittent contact SECM : two examples in corrosion Scanning Probes – Application Note 6
Latest updated: June 13, 2024Abstract
M470 is the only commercial SECM to offer the intermittent contact capability, which is a technique that allows one to track the topography of the sample during an SECM or ac-SECM measurement. Any contribution of the topography to the electrochemical response measured at the probe tip is removed, in the same manner as a constant distance measurement. Contrarily to the method shown in SCAN-Lab AN#2 and #3 (hyperlinks), only one single scan is required to get both topographical and electrochemical information.
Introduction
The M470 is the only commercial scanning electrochemical microscope on the market to be equipped with the intermittent contact- Scanning ElectroChemical Microscopy (ic-SECM) capability. This innovative technique, developed in collaboration with the University of Warwick1,2, allows one to track the topography of the sample during an SECM or ac-SECM measurement, hence removing any contribution of the topography to the electrochemical response measured at the probe tip. For more info on this technique, please see the tutorial on the Bio-Logic website3 or the introduction movie4.
This note will give further insight in the way ic-SECM is operated in the M470 software and give a few results that will illustrate the huge benefits resulting from using ic-SECM, compared to constant height SECM.
Principles
It is highly recommended to read the tutorial and publications about ic-SECM [1-4] in order to get the most benefit from this application note. Nonetheless a brief explanation of the technique will be given below.
ic-SECM is similar to AFM in tapping mode in that the probe is actually contacting the surface in a discontinuous way. ic-SECM is similar with shear force SECM in that a mechanical method is used to record and track the topography of the surface.
The fact that it is mechanical (and not electrochemical, such as in constant current SECM) ensures that any electrochemical response variation will not affect the topography measurement and vice versa.
Setup description
The SECM probe is a disk Ultra Micro Electrode (UME), that is tightly held in the holder shown in Fig. 1.

Figure 1 : ic-SECM set-up.
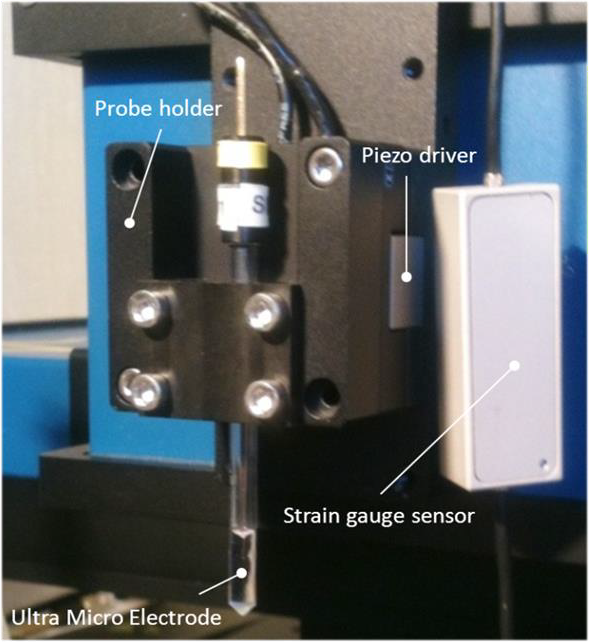
The holder is attached to the piezo driver, which is also used in the SVP and SKP experiments. The piezo driver drives the vibration of the probe usually at a low frequency (100 to 600 Hz) and a small amplitude (100 nm to 4 µm). The piezo driver block (Fig. 1) has two wires connected to it, one is for the input ac signal that will drive the piezo and the other is for the measurement of the amplitude of the vibration by the strain gauge sensor.
How is intermittent contact achieved ?
In ic-SECM the probe always vibrates and the amplitude of the vibration is always measured. Let us say the probe is vibrating at an amplitude $\Delta Z_\text f$, as it is approached towards the sample the vibration will be dampened and the amplitude reduced down to a certain user-defined set value $\Delta Z_\text{set}$.
A PID (Proportional Integral Derivative) loop constantly maintains the value of the vibration measured by the strain gauge at the value $\Delta Z_\text{set}$, by acting on the height of the probe.
If the probe is now scanned over a sample with a variable topography, the PID loop will act on the $Z$ scanning head to change the height of the probe such that the measured amplitude is always at the set value $\Delta Z_\text{set}$.
This has two consequences on the SECM measurement : i) there is no effect of the topography on the electrochemical response, ii) the highest dynamics are ensured in the electrochemical response, since the probe, being in intermittent contact, is as close as possible to the sample.
Operation
ac characterization
The first step is to characterize the ac response of the piezo, when the cables are connected, the probe is mounted on the holder and dipping in the solution. The purpose of the ac characterization is to find the resonant frequency of the piezo + probe holder + tip + cables ensemble, which will be used as a working vibration. Figure 2 shows a typical ac response.

Fig. 2: Typical ac characterization of the system consisting of the piezo, the probe holder, the SECM probe inside the solution and the cell cable connected to the probe.
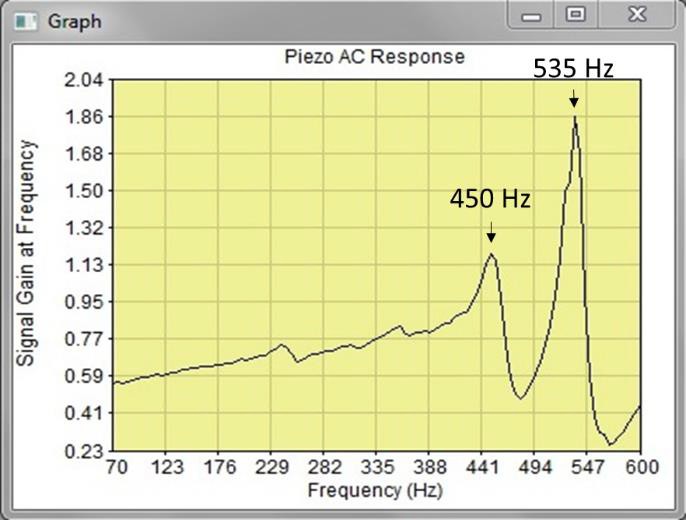
One can see two resonant frequencies, one at 450 Hz and a sharper one at 535 Hz. It is recommended not to use a sharp frequency as over the course of an experiment, the probe moves and the resonant frequency can shift a little. If it is too sharp then, the resonance will be lost, as over the experiment the vibration frequency does not change. If we choose a less resonant (lower amplitude) but blunter peak then the loss of resonance is not as dramatic, but the sensitivity is decreased. It is also recommended to use a frequency a few hertz lower than the peak, for instance, if we choose the blunt peak, 445 Hz.
Auto-approach
One of the key feature of ic-SECM is that there is no need to manually perform an amperometric or impedancemetric approach curve as is done in SECM or ac-SECM. The system detects the surface by measuring a decrease in the vibration amplitude, down to a certain percentage of the bulk amplitude. This value is maintained over the area scan in the x, y directions.

Fig. 3 : Experiment configuration window with ic-PID settings tab.
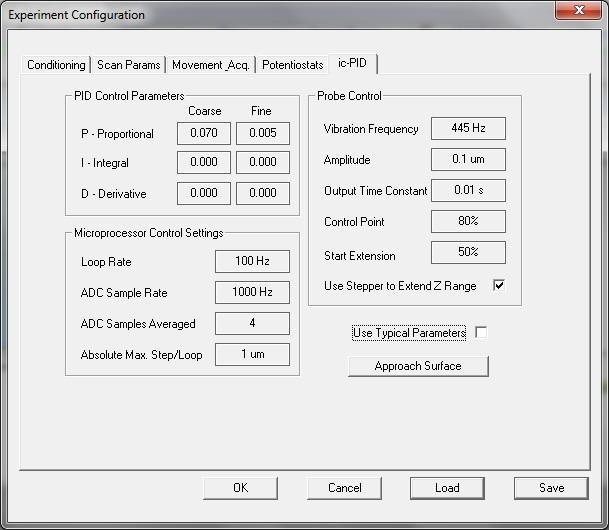
One can change the parameters using the ic-PID tab shown on the ic-SECM Area Scan Experiment Configuration window (Fig. 3).
The ic-PID tab is where the used frequency would be entered after ac characterization, as well as the amplitude $\Delta Z_\text{f}$ and the control point, which is a certain percentage of the “free” amplitude and defines the control amplitude $\Delta Z_\text{set}$. More details about the other parameters can be found in the manual.
Clicking “Approach Surface” will start the approach. If the experiment is started without clicking on “Approach Surface”, the approach is done automatically when starting the experiment.
Results
Welded steel

Figure 4: Picture of the welded steel used a sample. The width of the welded part is 6.4 mm. The analysed area is outlined by the white square.
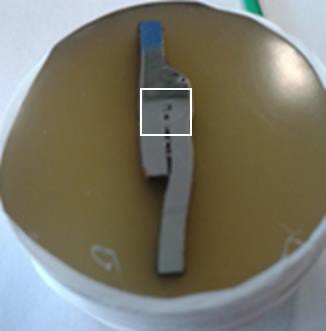
The sample is a piece of welded steel sampled from a popular commercial vehicle’s front suspension arm (Fig. 4). The electrolyte is 0.1 mol/L NaOH. In such an environment, the sample corrodes and produces Fe2+.
The probe is polarized at 0.6 V vs. Ag/AgCl reference electrode to oxidize Fe2+ to Fe3+.
An area of 4.5 x 4.5 mm2 was analysed with 45 µm steps. For each line, there was a delay of 0.5 s. The scan was performed in step Scan Mode with a velocity of 45 µm/s. The probe diameter was 25 µm.
SECM requires the probe to be in the vicinity of the sample surface where it is known that the reaction at the probe will be influenced. Scanning a large area is almost impossible with normal SECM because the tilt will be never small enough to avoid probe crash. With ic-SECM, as the probe follows the topography of the sample, such large areas are easily scanned as can be seen in Fig. 5.

Figure 5: ic-SECM scan of the welded steel at Open Circuit Potential (OCP) in 0.1 mol/L NaOH, with the probe polarized at 0.6 V/Ag/AgCl.
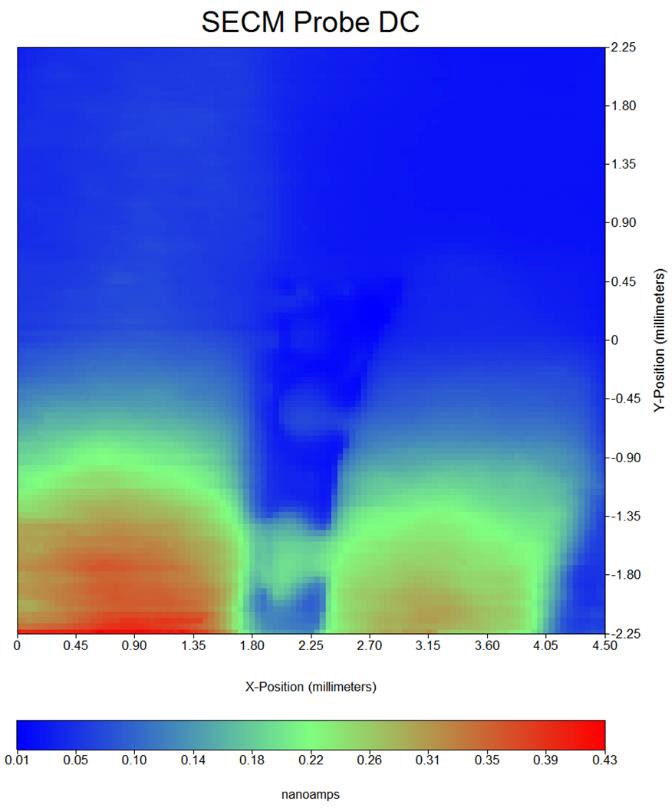
The scan starts from the bottom left corner to top right corner. The activity decreases as the scan is performed, most probably due to the formation of a passive rust layer Fe(OH)3 on the surface of the sample. The two welded samples can be seen in the beginning of the scan as well as the insulative part in the middle of the two welded parts.
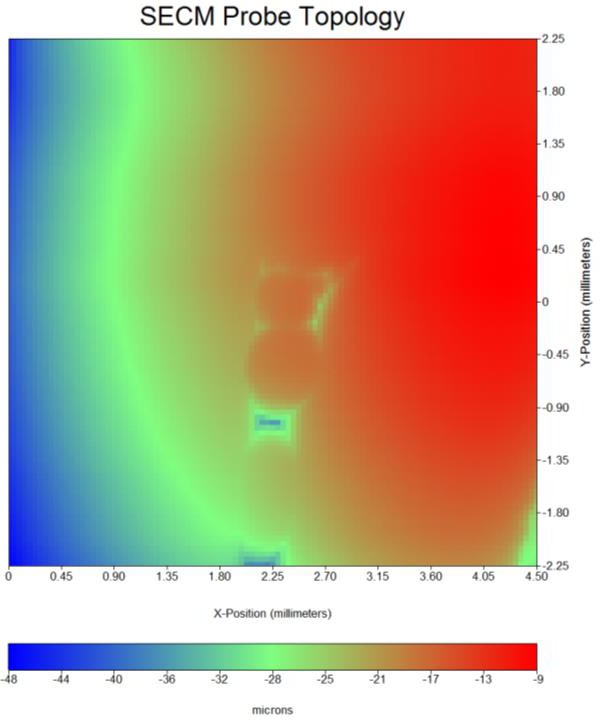
Simultaneously to the electrochemical activity, the topography is measured as shown in Fig. 6. The value shown is the height of the probe hence the red area is higher than the blue area. The topography change is around 40 µm. Again the welded parts and the insulator between the two samples can be seen.

Figure 6: Topography map obtained with SECM used in intermittent contact.
7075 Aluminum alloy
In this example a scratched 7075 Al alloy was studied. In this case the particular advantage of ic-SECM that will be shown is not to be able to study large tilted samples but to account for surface roughness in an SECM measurement.
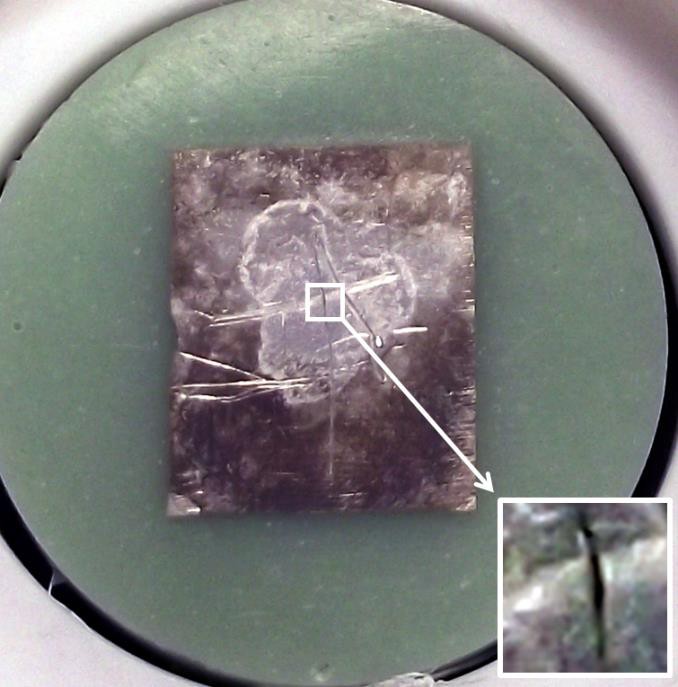
Figure 7 shows the sample under study as well as the analysed area outlined in white and zoomed in in the bottom right corner. The analysed area was 1 x 1 mm2. The sample was immersed in 0.1 mol/L KCl, and ac-SECM was performed. The SECM probe of diameter 15 µm was submitted to sinusoidal potential modulation of 10 mV at a 10 kHz frequency around OCP. The ac approach was performed by steps of 10 µm on an unscratched part of 7075. The ac approach curve is typical of an insulative material, which is the case of the unscratched Al alloy covered by very stable, thin layer of alumina and aluminium hydroxides (Fig. 8).

Figure 7: Picture of the scratched 7075 sample after ic- SECM experiment. The white square and the close up shows the analysed area, which presents the scratched cross.
ac-SECM allows one to perform SECM measurement without the use of a mediator as the response used to study the local conductivity of the surface is the impedance of the probe. For more information, please see the tutorial on the Bio-Logic website [5]. Nonetheless, ac-SECM suffers from the same drawback as SECM which is the influence of topography on the probe response. The use of ic-SECM can eliminate this drawback as can be seen in Fig. 9.

Figure 8: ac approach curve performed on unscratched 7075 alloy. The response is typical of that of an insulator.
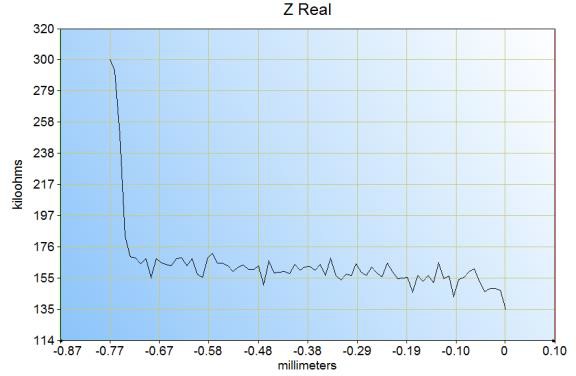
Figure 9 a) shows an ac-SECM area map of the area outlined in Fig. 7. The 3D plot was made using MIRA software. For more information about MIRA, please see the Application Note on the BioLogic website [6].
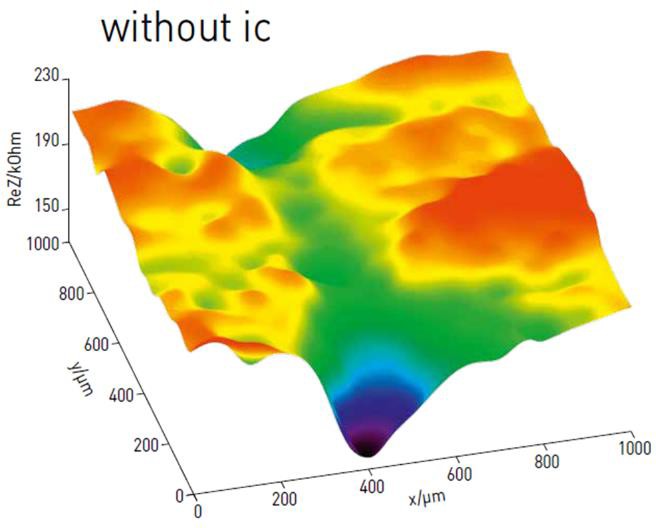
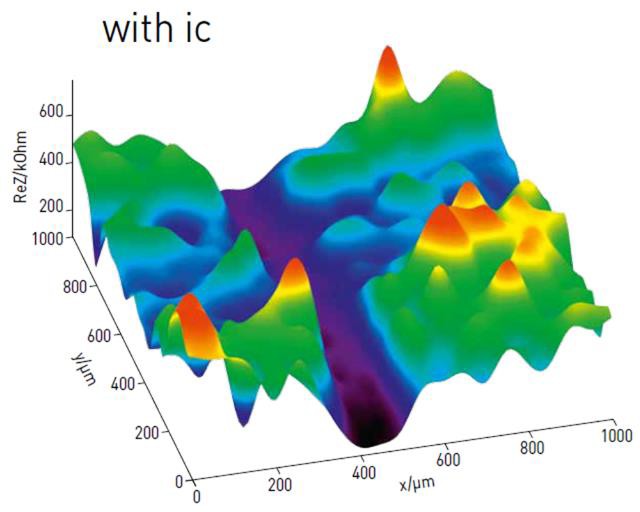
Figure 9: ac-SECM picture of the 7075 scratched sample in 0.1 mol/L KCl a) without intermittent contact, b) with intermittent contact.
The value on the z-axis is the real part of the impedance ReZ/kOhm. One can see the vertical scratch but not the horizontal scratch. The probe being scanned at constant height, the reason why the vertical scratch is seen is because it creates a groove in the sample. The groove is not deep enough in the case of the horizontal scratch.
If we consider the same area scanned with ac-SECM with intermittent contact (Fig. 9b), both scratches are visible, as the contrast is not due to topography but to the fact that the revealed substrate is more conductive than the oxide layer. Furthermore, there is a much better contrast in the case of ic-SECM i.e., the impedance response range is wider.
Conclusion
This note is an introduction and an illustration to and of the advantages of using ic-SECM in the field of corrosion studies. Two systems were studied: a welded steel sample and a scratched 7075 Al alloy.
On the welded steel sample, the advantage of ic-SECM is that a large surface can be studied, in this note around 20 mm2, without the SECM probe crashing into the sample.
On the Al sample, the advantage of ic-SECM is that the contrast in reactivity is revealed more clearly and the effect of topography is removed.
For both cases, the signal at the tip is maximised due to the closeness of the probe to the sample.
References
- K. Mc Kelvey, M. A. Edwards, P. R. Unwin, Anal. Chem. 2010, 82, 6334–6337
- K. Mc Kelvey, M. E. Snowden, M. Perulo, P. R. Unwin, Anal. Chem. 2011, 83, 6447–6454
- ic-SECM tutorial
- ic-SECM introduction movie
- ac-SECM tutorial
- MIRA application note


