

The use of height tracking SECM to measure mechanically exfoliated graphite Scanning Probes – Application Note 17
Latest updated: June 14, 2024Abstract
In this note, SECM is used in feedback mode to image the changes of conductivity of an exfoliated graphite sample deposited onto insulative substrate. dc-SECM was used in constant distance mode to avoid any damage to the fragile graphene layers by the tip. Topography measurements were performed using intermittent contact.
Introduction
At present there is growing interest in 2D materials for both their practical and experimental applications. At the centre of this growing field is graphene, whose discovery was awarded the Nobel Prize in 2010 [1]. Exfoliated graphite is a precursor material to graphene and therefore it is of interest to fully understand its electrochemistry.
Although SECM has previously been used to measure graphite in a variety of forms, much of this has focused on understanding its role as an electrode for Li batteries [2-4]. Recently, however, the electrochemical properties of graphene oxide have been measured using SECM by investigating its interaction with a variety of redox couples [5]. The electrochemical activity of graphene has also been measured by SECCM allowing the effects of the number of graphene layers and step edges to be examined [6, 7]. In this note we present the use of the M470 to measure the electrochemical activity of mechanically exfoliated graphite using dc-SECM.
On the scale of the SECM measurement mechanically exfoliated graphite is flat, however, sample tilt may result in the SECM probe touching the graphite flake. In the worst case scenario this can fully remove the flake of interest. To ensure the graphite flake remained intact this measurement was performed using a background topography map collected during an ic-SECM area scan, taken in an area adjacent to the graphite flake of interest, to perform a height tracking SECM measurement.
Method
Samples composed of graphite flakes which were mechanically exfoliated onto a Si/SiO2 substrate were provided by Dr Hollie Patten of the University of Manchester. These samples were measured with dc-SECM using the M470. dc-SECM was performed using height tracking, based on the topography measured during an ic-SECM measurement on the Si/SiO2 substrate adjacent to the flake of interest. Height tracking was used to remove the effect of background tilt of the sample, and to avoid crashing the tip into the sample.
The SECM measurement was performed in 5 x 10⁻³ mol L-1 KI and 100 x 10-3 mol L-1 KCl aqueous solutions, with a 15 µm Pt UME biased at 0.6 V vs SCE. A step size of 15 µm was used. Prior to the measurement the UME probe was held at 0.6 V vs SCE until the probe measured a constant current.
The M470 software offers users the option of performing both ac- and dc-SECM measurements in constant height or constant distance mode.
Constant height mode is the default technique for all standard SECM measurements. In this case the probe is held at a set z position throughout the measurement. This position is usually determined based on approach curve experiments to the sample. When using constant height mode if there is some topography change in the sample the probe to sample distance changes.
In constant distance mode the z position of the probe changes, allowing the probe to follow the sample topography, and keep the probe to sample distance constant. Constant distance mode is selected in standard SECM measurements by selecting the ‘Height-Tracking’ tick option, Fig. 1.
To perform these measurements a previously recorded topography scan must be used. The topography file may come from any technique of the M470 or M370 with a topography map output (ic-SECM, OSP, CHM, or CTM measurement) and must match the area, step size and number of points of the desired electrochemistry map. Height tracking may only be performed in step scan mode in order to allow for the readjustment of the z position throughout the measurement. More information on using height tracking for SECM may be found in AN#2 and 3 [8, 9].
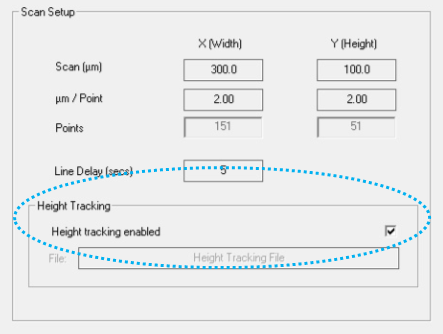
Figure 1: Height tracking is a tick box option in the ‘Scan Params.’ tab in the SECM area scan configuration.
In this experiment, the sample was setup on a flat Si/SiO2 substrate. This allowed us to measure the sample tilt in one location and then track the same sample tilt in another area. An ic-SECM experiment was initially performed to access the topography information required for the subsequent SECM height tracking experiment. By carrying out the ic-SECM measurement on the Si/SiO2 substrate in the vicinity of, but not over, the graphite flake of interest damage to the flake was avoided, whilst still being as near to it as possible. To allow the ic-SECM background measurement to be performed more quickly a larger step size than in the final measurement was used, resulting in a measurement with fewer points.
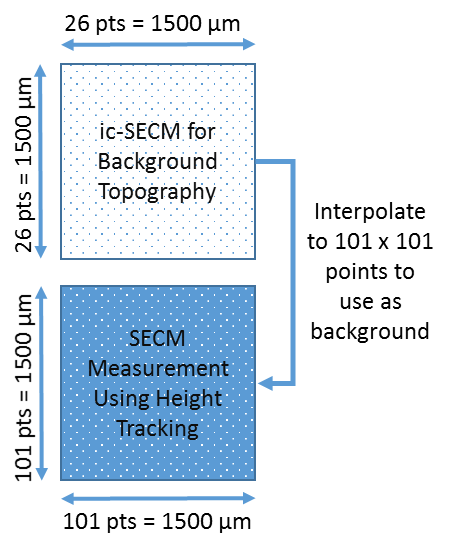
Due to the discrepancy in the number of points between the topography measurement and the final measurement of interest it was necessary to interpolate the topography measurement to the appropriate size. This is performed using the ‘Analysis Functions’ option in the right-click menu of the area map, Fig. 2. Further information on the analysis functions can be obtained from Scan-Lab AN#8 [10]. Once the topography map has been interpolated to the appropriate size and saved it can be used in the height tracking measurement. This is outlined schematically in Fig. 3.

Figure 2: An area map can be interpolated to a larger or smaller number of points using Analysis Functions à Interpolate in the area map right-click menu.
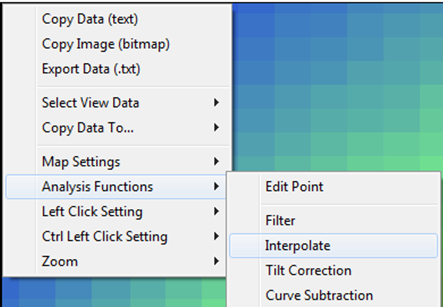

Figure 3: The necessary interpolation to use the original background file as the topography for height tracking SECM is shown.
With the background topography file created the initial probe z axis position must be determined. To do this an approach curve was performed to the largest graphite flake in the measurement area allowing a z axis position for the measurement to be found.
Data treatment of the resulting 2D map was performed in Gwyddion.
Results
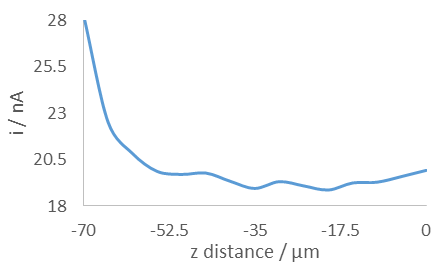
Approach to the largest graphite flake in the region of interest shows positive feedback response, indicative of a conductor, Fig. 4. It should therefore be possible to measure the contrast between the flake and the insulating Si/SiO2 substrate using SECM.

Figure 4: A positive feedback response was measured when SECM approach was performed to the graphite flake in 5 x 10⁻³ mol L-1 KI and 0.1 mol L-1 KCl.
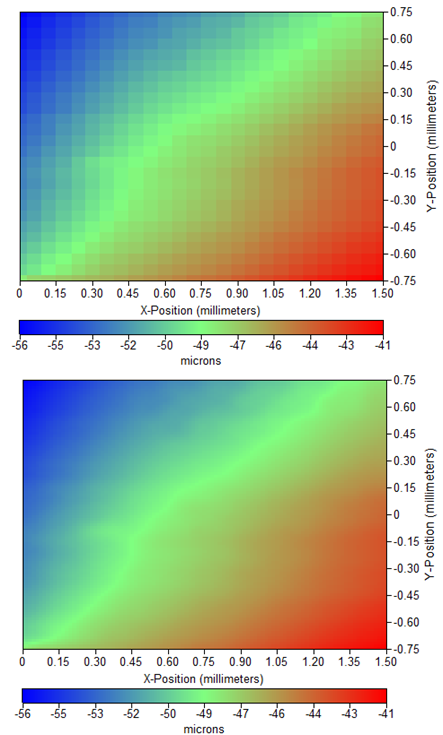
The original and interpolated background topography measurements are shown in Fig. 5. It can be seen that there is a small background tilt in the sample of around 15 µm over 1.5 mm (~ 0.4°). In SECM the probe to sample distance is directly related to the current magnitude measured over a conductor, and inversely related to the current over an insulator. If the measurement was performed without correcting for background tilt the current measured would be affected. While this effect can be accounted for using ‘Tilt Correction’ in the M470 software this is done after the measurement and does not account for the relative contrast changes that occur with the probe to sample distance changes.
A more important issue, however, is that a tilted sample may cause the SECM probe to touch the sample. The graphite flakes are thin, and as a result can be removed from the Si/SiO2 substrate if they are contacted by the tip. To avoid this the sample tilt must be accounted for whilst the measurement is carried out.

Figure 5: Original (top) and interpolated (bottom) topography map used as background in height tracking SECM.
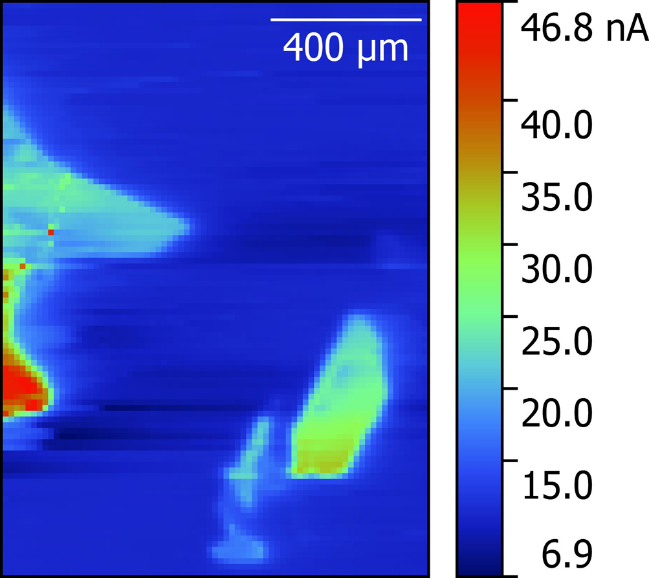
Using SECM with height tracking it is possible to remove the effect of the sample tilt during the measurement. By removing the sample tilt with the interpolated background it was possible to measure the electrochemical activity of the graphite flake. This is shown in Fig. 6. A clear distinction between the insulating Si/SiO2 (dark blue) substrate and the conducting graphite flakes can be seen.
A number of flakes of differing activities have been measured. As only sample tilt has been accounted for in these measurements the decreasing tip-sample distance which arises from increasing the number of graphite layers may play a role in the increased activity seen for some flakes. Importantly we can also gauge how well the height tracking has worked in this sample case as we can see that the homogeneous substrate response (dark blue) is constant across the map. This leads us to conclude that the measurement was indeed taken as a constant-distance mode SECM measurement.

Figure 6: SECM area scan of mechanically exfoliated graphite flakes in 5 x 10⁻³ mol L-1 KI and 0.1 mol L-1 KCl. Measurements were performed in height tracking mode.
Conclusion
SECM with height tracking allows constant distance SECM to be performed. This technique was used to measure a mechanically exfoliated graphite flake sample without the interference of sample tilt. Through this technique the electrochemical activity of a mechanically exfoliated graphite sample could be measured without disturbing the sample.
Acknowledgements
The graphite sample presented in this note was provided by Dr Hollie Patten and Prof. Robert Dryfe of the University of Manchester. Dr Hollie Patten is funded by the EPSRC.
References
- S. Novoselov, A. K. Geim, S. V. Morozov, D. Jiang, Y. Zhang, S. V. Dubonos, I. V. Grigorieva, A. A. Firsov, Science 22 (2004) 666-669
- Xu, C. Jung, Int. J. Electrochem. Sci. 9 (2014) 380-389
- Ventosa, W. Schuhmann, Phys. Chem. Chem. Phys. 17 (2015) 28441
- Bülter, F. Peters, J. Schwenzel, G. Wittstock, Angew. Chem. Int. Ed. 53, 39 (2014) 10531-10535
- Rapino, E. Treossi, V. Palermo, M. Marcaccio, F. Paoluccia, F. Zerbettoa, ChemComm, 50 (2014) 13117-13120
- G. Güell, A. S. Cuharuc, Y.-R. Kim, G. Zhang, S.-y. Tan, N. Ebejer, P. R. Unwin, ACS Nano 9, 4 (2015) 3558-3571
- R. Unwin, A. G. Güell, G. Zhang, Acc. Chem. Res. 49 (2016) 2041-2048
- Application Note #2 “SECM height relief with OSP: An application in corrosion”
- Application Note #3 “SECM height relief with OSP: An application in sensors”
- Application Note #8 “Graphical and analysis tools in M370/M470 software”


