

Sensitivity Detection limits using proteinsEkkO – Spectroscopy – Application Note 32
Latest updated: March 1, 2023Abstract In this note, we present CD measurements of (a)-lactoglobulin, Cytochrome C, Hemoglobin and Lysozyme with variable well volumes and concentrations to address the sensitivity of the EKKO; CD Microplate Reader for CD measurements. We show the EKKO; CD Microplate Reader is linear for the determinations of absorbance and CD up to a value of ~ 1.2 equating to a protein concentration of 50 to 100 μg/ml for a helical protein.
Introduction
Circular dichroism (CD) refers to the differential absorption between left and right circularly polarized light is commonly used for chiral analysis.
Recently these determinations have been expedited by the addition of robotic liquid handling systems coupled to a conventional CD spectrometer. However, transferring individual samples and cleaning the cuvette between measurements makes CD measurements with traditional CD Spectropolarimeters a time-consuming process.
The EKKO™ CD Microplate Reader uses a vertical light path allowing the CD measurements to be read from a well plate directly. As such, the time consuming processes of 1) transferring the contents from each well of a well plate into a cuvette, and 2) cleaning the cuvette between measurements have been eliminated. This significantly increasing productivity, as much as 100-fold with respect to standard CD’s coupled to a robot1,2,3. Even with several types of commercially available well plates, the effective path length will be determined by the upper surface of a solution in the well. It is also expected that the presence of the meniscus would affect the CD measurement results regardless of volume in the well. 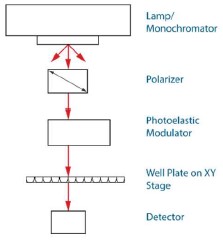
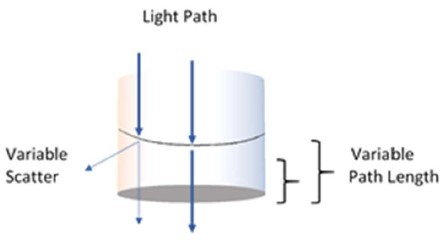
Fig. 1. Presumed effects on the light path as a function of volume and the meniscus in a well.
At a minimum, the combination of the variable path length and meniscus effects have the potential to alter CD determinations when compared to traditional technologies which have fixed path lengths and no meniscus because both events meaningfully affect the intensity of the observed CD signal. In this note, we present CD measurements of (a)-lactoglobulin, Cytochrome C, Hemoglobin and Lysozyme with variable well volumes and concentrations to address the sensitivity of the EKKO™ CD Microplate Reader for CD measurements.
RESULTS & DISCUSSION
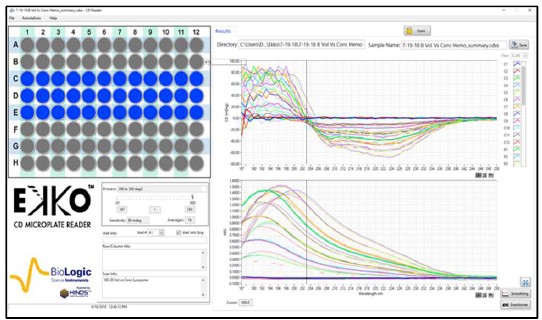
Fig. 2. CD spectra Matrix of Hemoglobin with increasing concentrations and volumes.
Samples of 100, 150, or 200 μl of Hemoglobin (Sigma) at 20 to 100 μg/ml were loaded in wells #C1 to #E12 of a solid fused silica 96 well plate (Hellma). No effort to reduce the noise was made to collect the raw data.
Fig. 3. CD spectra Matrix of Lysozyme with increasing concentrations and volumes.
Samples of 100, 150, or 200 μl of Lysozyme (Sigma) at 20 to 100 μg/ml were loaded in wells #F1 to #H12 of a solid fused silica 96 well plate (Hellma). No effort to reduce the noise was made to collect the raw data.
Figures 2 and 3 are representative matrices of the CD and Absorbance data obtained for increasing concentrations of protein at loads of 100, 150 & 200 μl per well. As expected, increasing concentrations of protein distorted the CD spectra at the higher ends of the matrices regardless of volume added within the well when compared to known spectral characteristics of the proteins involved. Similar results were obtained with α-Lactoglobulin and Cytochrome C. To determine where the deviation from linearity in both the CD and Absorbance in the measurements occurred, Absorbance and CD were plotted as a function of increasing concentration at multiple wavelengths for each of the matrices.
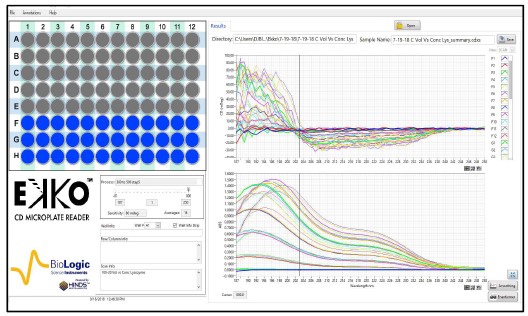
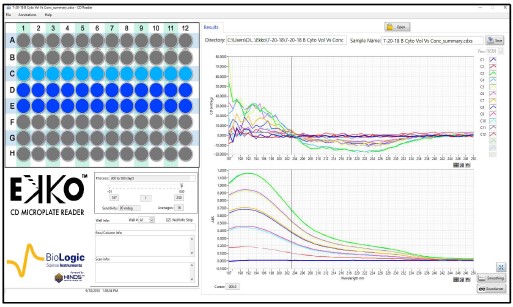
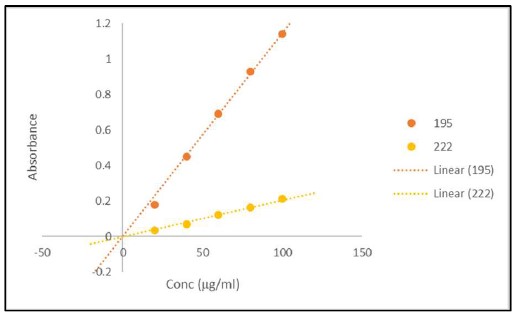 Fig. 4. Signal versus Concentration for Cytochrome C Matrix
Samples of 100 μl of Cytochrome C (Sigma) at 20 to 100 μg/ml were loaded in wells #C1 to #C12 of a solid fused silica 96 well plate (Hellma). No effort to reduce the noise was used to collect the raw data (top). Replots of the Absorbance 100 μl of Cytochrome C as a function of concentration for 20 to 100 μg/ml at 195 and 222 nm (middle). Replots of the CD 100 μl of Cytochrome C as a function of concentration for 20 to 100 μg/ml at 195 and 222 nm (bottom).
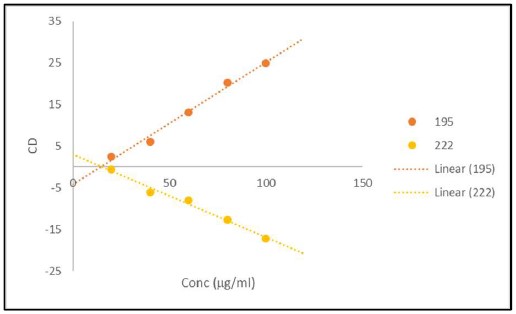

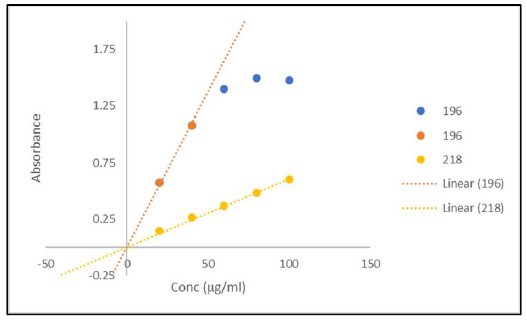 Fig. 5. Signal versus Concentration for α-lactoglobulin Matrix.
Samples of 200 μl of α-lactoglobulin (Sigma) at 20 to 100 μg/ml were loaded in wells #H1 to #H12 of a solid fused silica 96 well plate (Hellma). No effort to reduce the noise was made to collect the raw data (top). Replots of the Absorbance 100 ml of α-lactoglobulin as a function of concentration for 20 to 100 μg/ml at 196 and 218 nm (middle). Replots of the CD 100 ml of α-lactoglobulin as a function of concentration for 20 to 100 μg/ml at 196 and 218 nm (bottom).
Figures 4 and 5 are representative replots of the signal verses concentration for the various volumes included in the protein matrices. They illustrate that the signal intensities for the differing secondary structure composition of the protein will have a profound effect on the usable concentration for any CD measurement as expected. Furthermore, they demonstrate that signals are usable up to an absorbance value of approximately 1.2. The mean value for the last usable absorbance point before deviation from linearity in both absorbance and CD is 1.2 ± 0.1 Abs units. This equates to an approximate concentration of 50 to 100 μg/ml per mm path length (approximated as the volume in a column for any given addition) for a fully helical protein.
As with conventional technologies for the measurement of circular dichroism, any sample which has an absorbance value below ~1.2 will result in a reliable measurement and be within the linear range of the EKKO™ CD Microplate Reader.
SUMMARY & RECOMENDATIONS
1. The EKKO™ CD Microplate Reader is linear for the determinations of absorbance and CD up to a value of ~ 1.2 equating to a protein concentration of 50 to 100 μg/ml for a helical protein.
2. The EKKO™ CD Microplate Reader has similar detection limits as standard CD Technologies.
It is recommended that the precise concentration and volume needed be empirically determined under normal operations given the potential meniscus effects resulting from the physical characteristics of the buffer components.
References
1) Metola, P., Nichols, S.M. Kahr, B., and Anslyn, E.V., Well plate circular dichroism reader for the determination of enantiomeric excess. Chem. Science. 5, 4278-4282 (2014).
2) Jo, H.H., Cao, X. You, L., Anslyn, E.V., and Krische, M.J., Application of highthroughput enantiomeric excess optical assay involving a dynamic covalent assembly: parallel asymmetric allylation and ee sensing of homoallylic alcohols. Chem. Science. 6, 6747-6753 (2015).
3) Fielder, S., Cole, L., and Keller, S., Automated Circular Dichroism spectroscopy for medium throughput analysis of protein conformation. Anal. Chem. 85, 1868-1872 (2013).
4) Hussain, R., Javorfi, T., Rudd, T. R., and Siligardi, G., High-throughput SRCD using multi-well plates and its applications. Nature, Sci Reports 6, 38028 (2016).


