Battery cycling with reference electrodes using the PAT-cell test cell Battery – Application Note 58
Latest updated: January 31, 2024Abstract Investigation of batteries with a reference electrode have becomes more and more common. To achieve this, researchers need advanced testing cells along with advanced potentiostats/galvanostats. In this note, to show the advantage of a test cell equipped with a reference electrode, we describe a typical cycling experiment of a lithium-ion battery.
Introduction
Until recently, to study both the positive and the negative electrode of batteries, researchers investigated half-cells. It is now becoming increasingly common to study a battery with a reference electrode. [1-2] With this configuration, researchers can obtain information simultaneously from both electrodes.
To achieve this goal, researchers need advanced testing cells along with advanced potentiostats/galvanostats. Because of the outstanding reliability of the built-in lithium metal reference electrode, the PAT-Cell is the ideal test cell for long-term 3-electrode experiments on Li-ion battery systems. With this device, the user can build an experiment cell and test the materials of the cathode and anode electrodes. The Bio-Logic potentiostat/galvanostat is a perfect match for controlling this type of experiment, as it is capable of monitoring the half-cell voltages while controlling the full cell voltage. In this note, in order to show the benefits of the PATCell equipped with reference electrode, we describe a typical cycling experiment of a lithium-ion battery. This comprised of a NMC (Nickel Manganese Cobalt) cathode and a graphite anode (both with a capacity of ~2 mA·h·cm-2, purchased from CCI) in a conventional LiPF6 based electrolyte (1 mol·L-1 in Ethylen Carbonate/ DiMethylCarbonate 1:1 with 2% Vinylen Carbonate, BASF).
EXPERIMENTAL SET-UP
Fig. 1 depicts the PAT-Cell docked into the PAT-Single-Stand [4], and connected to the Bio-Logic VSP potentiostat galvanostat.
A 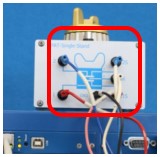 B
B 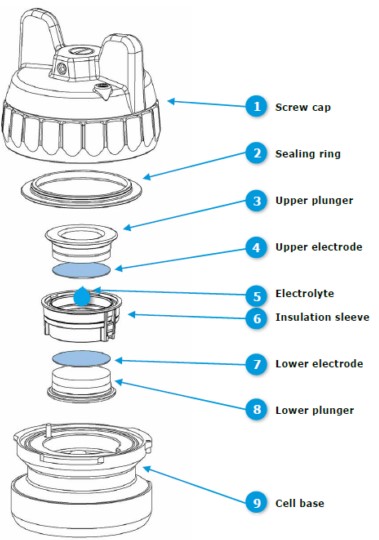 Figure 1: A) Experimental set-up with the PAT-Cell docked into the PAT-Single-Stand (in the red rectangle) connected to the VSP potentiostat. B) Exploded view of the PAT-Cell.
EC-Lab® software provides several powerful GCPL techniques which can be used for battery cycling with Constant Current/ Constant Voltage (CC/CV) including sophisticated Galvanostatic Intermittent Titration Techniques (GITT). GCPL is the acronym for Galvanostatic Cycling with Potential Limitation. The GCPL techniques differ in several options such as the available step end conditions and the potential control modes used. Differences between GCPL techniques are explained in the Technical Note #30 [5].
In this experiment, we have applied the GCPL6 technique, which allows control of the full cell voltage between the NMC cathode (socket 1 at the PAT-Single-Stand) and the graphite anode (socket 2). At the same time, the GCPL6 technique records the two half-cell voltages and the voltage of the full cell:
• The voltage between NMC and the lithium reference (sockets 1S and R of the PAT-SingleStand). This variable is named EWE in EC-Lab®.
• The voltage between graphite and the reference (socket 2S and R of the PAT-SingleStand). This variable is named ECE in EC-Lab®.
• The voltage between the positive and the negative electrode. This variable is named ECELL in EC-Lab®.
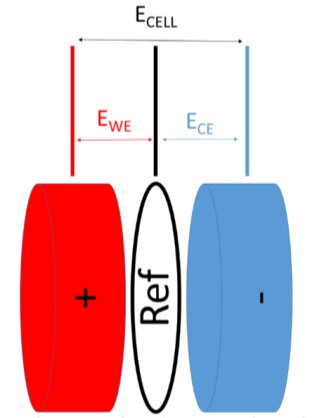
Figure 2: Configuration for a battery with a reference electrode.
NOTE: During the CV period, the voltage of the cell is controlled between the positive and the negative (and not between the positive electrode and the reference as per standard potentiostat mode).
The GCPL6 technique is available in SP-50, SP150, VSP, VMP3 and MPG-2 instruments. Because of this specific regulation mode during the CV step, the GCPL6 cannot be linked with potentio technique. To perform an EIS measurement, it should be linked to GEIS techniques.
It is possible to record the two half-cell voltages and the voltage of the full cell also with SP-200, SP-240, SP-300, VSP-300 and VMP-300 instruments.
Figure 3 shows a screenshot of the GCPL6 settings, the second of four overall sequences. Note that, in the Advanced Settings tab of the GCPL6 technique, ECE is ticked by default (Figure 4).
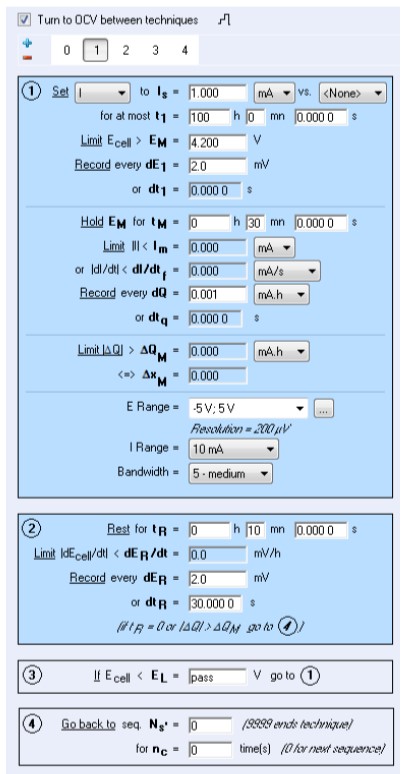
Figure 3: Sequence 1 of the GCPL6 setting
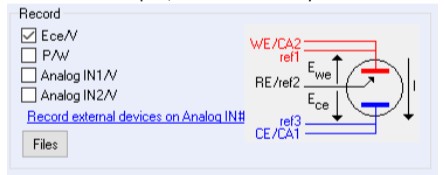
Figure 4: ECE ticked in the Advanced Setting tab.
CYCLING DISCUSSION
Figure 5 shows the voltage and current profiles of the overall experiment. The cut-off cell voltages were changed from 2.5/4.2 V during the initial cycle to 2.5/4.5 V in the 2nd cycle, 1.0/4.5 V in the 3rd cycle, 0.0/4.5 V in the 4th cycle, and 2.5/4.5 V in the last cycle. Throughout the experiment, the magnitude of the current was set to 1 mA, corresponding to a rate of approximately 0.2 C during the initial cycle. 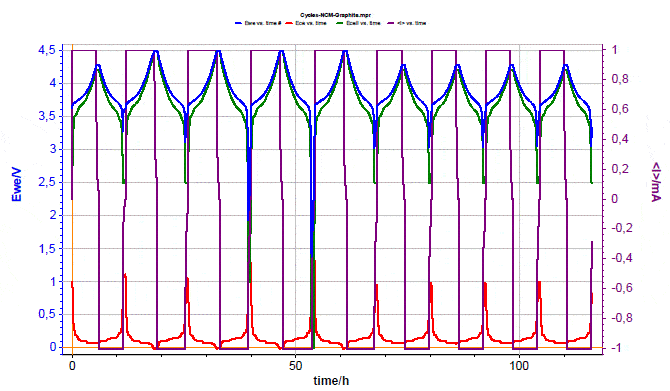 Figure 5: Voltage and current profiles of the overall experiment. The blue line corresponds to the positive half-cell voltage, the red line to the negative half-cell voltage, and the green line to the full cell voltage.
FIRST CYCLE (BETWEEN 2.5 AND 4.2 V)
The following graphs are merely details of Fig. 5.
Fig. 6 shows the evolution of the negative halfcell voltage during the formation cycle. One can clearly observe the staging plateaus of graphite. At the end of discharge, the graphite was still not fully lithiated. 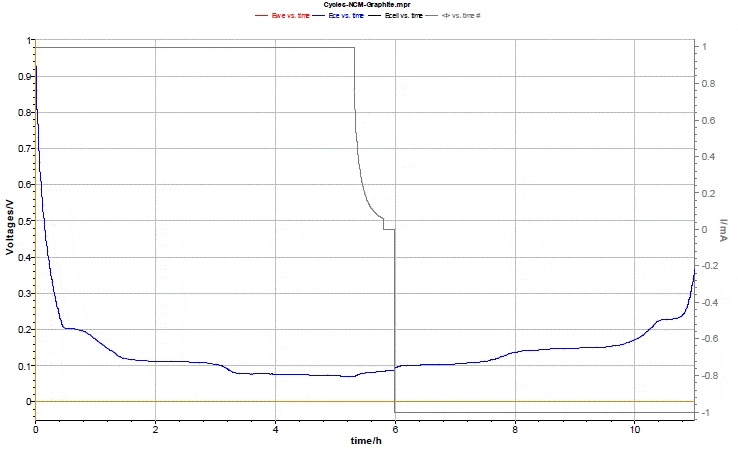 Figure 6: Evolution of the graphite half-cell voltage during first lithiation. The cut-off of the cell voltage was set to 4.2 V.
SECOND CYCLE (BETWEEN 2.5 AND 4.5 V)
The condition changed after increasing the upper cut-off voltage to 4.5 V, see Fig. 7. When increasing the cut-off cell voltage from 4.2 to 4.5 V, the graphite electrode can no longer accommodate all the lithium released from the cathode. As a consequence, the graphite potential drops to 0 V and plating occurs. The graphite electrode is no longer able to accommodate the lithium released from the cathode. Accordingly, plating of Li metal takes place, as can be seen from the drop of the negative half-cell voltage to 0 V. 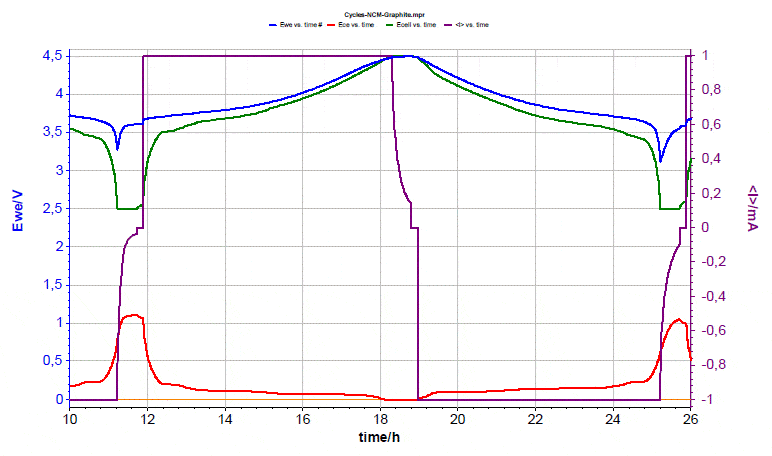 Figure 7: Voltages evolution during second cycle.
THIRD AND FOURTH CYCLE (BETWEEN 0.0 AND 4.5 V)
During the third cycle, the lower cut-off voltage was decreased to 1.0 V, in orderto see the effects of deep discharge. Discharge to below 2.5 V cell voltage is considered to potentially damage the Li-ion battery because the copper current collector of the anode may start to corrode at potentials above 3 V vs. Li. In this experiment, at a cut-off voltage of 1.0 V the graphite potential does not exceed 1.6 V vs. Li (Fig. 8). Even when lowering the cell voltage to 0 V in the subsequent cycle (Fig. 9), the graphite potential stays well below 3 V vs. Li. 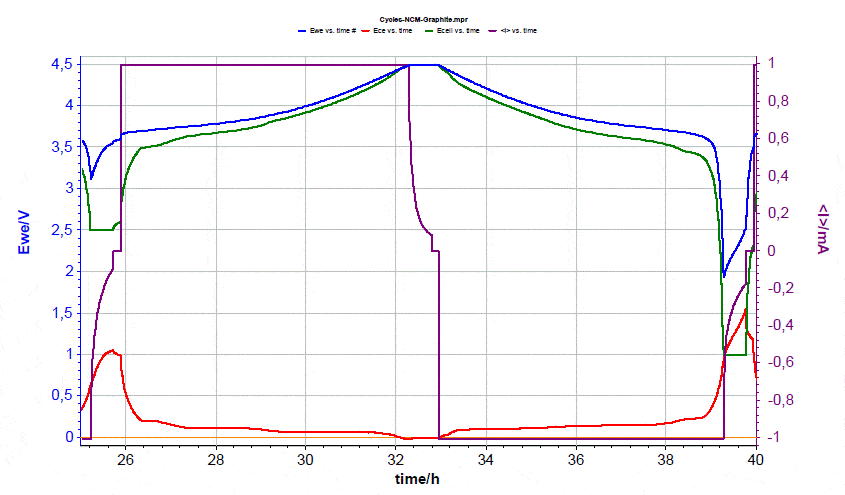 Figure 8: Voltages evolution during third cycle.
 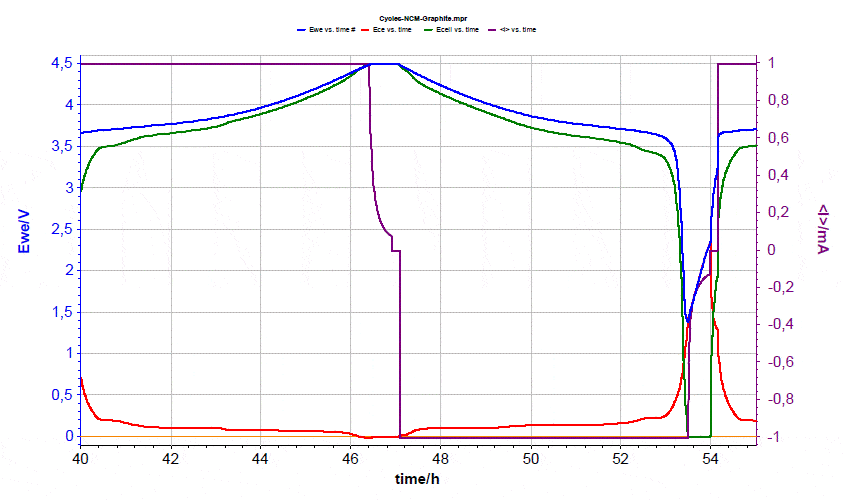 Figure 9: Voltages evolution during the fourth cycle.
FIFTH CYCLE (BETWEEN 2.5 AND 4.5 V)
Figure 10 depicts the last cycle of the experiment, again with the more regular cut-off cell voltages of 2.5 and 4.5 V. The battery did survive the two deep discharge cycles. The situation may change, however, when continuously cycling the battery, as the evolution of the absolute electrode potentials depends on the ratio of the two half-cell capacities. If the capacity loss of the graphite exceeds that of the NMC electrode, then the graphite electrode will continuously rise and eventually exceed the stability limit of the copper current collector. 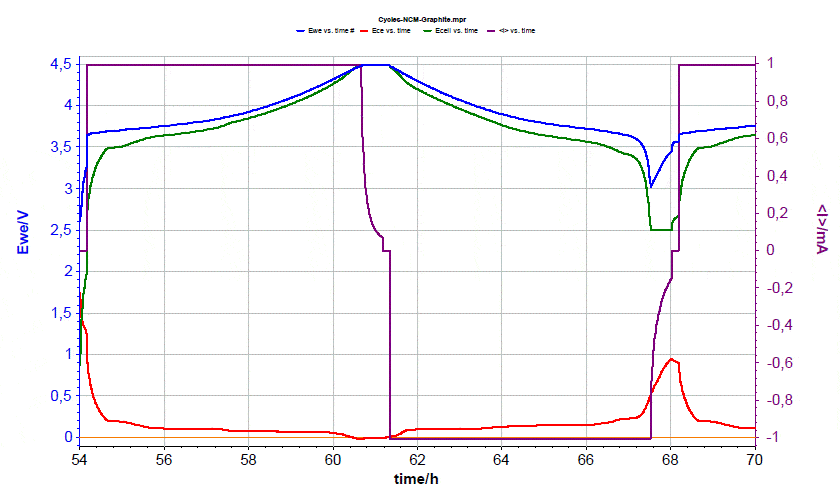 Figure 10: Voltages evolution during the last cycle.
Conclusion
This application note shows how to set up an experiment involving a battery with a reference electrode and how to take advantage of this configuration combining an advanced test cell and cycler. This note is focused on the cycling aspect. Notably, with the same set-up described here, it is possible to measure the half and full cell impedances of the battery as well (Fig. 11). This topic will be addressed in a separate application note. 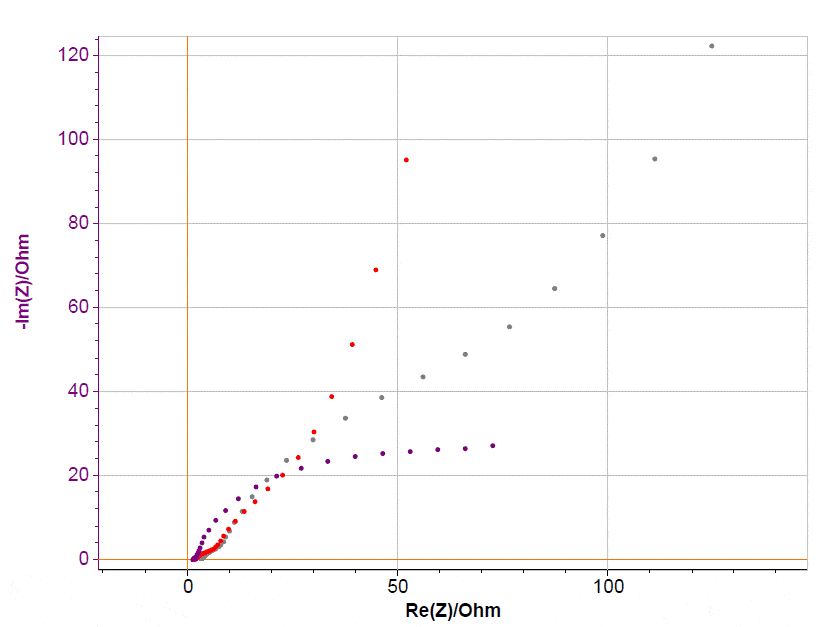 Figure 11: EIS data on NMC battery equipped with reference electrode.
Data files can be found in the installation package under the following folder on the user’s computer: C:\Users\xxx\Documents\ECLab\Data\Samples\Battery\AN58 folder
References
1) M Dolle, F. Orsini, A. S. Gozdz, and J.-M. Tarascon, J. Electrochem. Soc., 148, (2001) A851.
2) M. Klett, J. A. Gilbert, S. E. Trask, Bryant J. Polzin, A. N. Jansen, D. W. Dees, and D. P. Abraham, J. Electrochem. Soc., 163, 6 (2016) A875.
3) B. Le Gorrec, C. Montella, R. Yazami, J. Power Sources 97-97 (2001) 83.
4) More information on the cells are available on the web.
5) Technical Note #30 “Which GCPL technique is the most appropriate for my measurement?”
Revised in 08/2019