

Protocols for intercalation electrodes materials-2, Potentiodynamic Cycling/Galvanostatic Acceleration (PCGA) PITT Battery – Application Note 2
Latest updated: August 14, 2024Abstract
One way of obtaining differential capacity plots (DCA) is via constant current techniques and analyzing the charge passed (dQ) between consecutive voltage markers (dE or dV). This provides steady-state data and can be obstructed by any kinetic limitations in the material under study. Conversely, PITT allows to apply predefined voltage steps and integrate the current (calculate charge passed) until user-specified equilibrium conditions are achieved. When performed in a three-electrode configuration, this experiment can provide information about both the positive and negative electrodes of the battery.
In general, this technique allows the discrimination of solid-solution vs. two- (or multi-) phase mechanism of intercalation, as well as look at transients during each voltage step, nucleation and growth kinetics, voltage hysteresis, as well as, the density of states of the intercalation materials. More on DCA in Application note #40.
Introduction
The basic characteristic of an electroactive intercalation compound is the thermodynamic voltage-composition relation, which corresponds to the equilibrium phase diagram of the system. See for example Armand [1] for a detailed description of the various behavior that can be encountered, which depend upon the changes in electronic and structural properties upon intercalation/deintercalation.
In short, a continuous dependence of the potential vs. composition corresponds to a solid-solution single-phase domain whereas, a potential plateau corresponds to a two-phase domain.
Other properties of interest, particularly in view of possible applications as active electrodes in a battery are the potential windows of electrochemical stability, kinetics and reversibility of the intercalation process.
The voltage-composition relation can be determined either in a current controlled mode or in a potential controlled mode. These two techniques are usually referred to as “Galvanostatic Intermittent Titration Techniques” [2] and “Potentiostatic Intermittent Titration Techniques” [3].
The first method corresponds to performing successive charge increments by applying a constant current from a galvanostat for a given duration. This subject has been developed and explained in our first application note.
The second method consists in applying to the electrode using a potentiostat, a potential equal to its initial equilibrium potential. Then a step is applied to a potential value close to the initial one whereas recording of the chronoamperometric response is performed for a given duration. Then switching to open circuit makes possible the recording of the equilibrium potential, which will be as close to the previously applied potential as the final current was negligible at the cut-off.
Integrating the chronoamperometric response gives the charge increment using the following equation:
$$\Delta Q (t)=\int_t^{t+\Delta t}I(t)\text d t\tag{1}$$
whereas its shape can give information on the kinetics of the process at these potential levels. Repeating the experiment, one obtains a set of “incremental capacity” values, ΔQ (V) , with corresponding kinetic information, with a resolution in potential superior to the potential step amplitude.
An extension of this PITT protocol was proposed by A.H. Thompson [4] as Electrochemical Potential Spectroscopy. In this mode, the successive steps of potential are applied, without going through an open circuit period, every time the reduction (oxidation) current has reached a predefined value, which is considered as negligible compared to the capacity of the system. One obtains in this way, a set of quasi-equilibrium incremental capacities values, at periodic potential intervals corresponding to the potential step amplitude. When reported as ΔQ vs. the potential, the results of such an experiment are the incremental capacity voltammogram of the reduction/oxidation, that is a spectrum of the redox states of the system, obtained with the resolution of the potential step amplitude.
This can be compared to linear sweep cycling voltammetry, with the difference that instead of performing a potential sweep (either linear or staircase, but periodic in time) and recording the current, the duration of a potential step will depend on the kinetics of the processes at that potential. This is justified by the fact that the various redox processes that can occur successively in an intercalation electrode material usually have very different kinetics. For example, it may be controlled by the kinetics of the phase transformation in the two phase domains whereas it is diffusion controlled in the single-phase solid-solution domains. By comparison, with usual voltammetric studies of species solvated in a supporting liquid electrolyte and using a blocking electrode, the kinetics are governed by the diffusion coefficient of the species in the electrolyte, which does not depend significantly on the potential.
At this point, it is important to note that diffusion coefficient values in solids are about 4 to 8 orders of magnitude lower than in liquids (usually in the range of 10-8 to 10-12 cm²/s for materials of practical interest for batteries). With a diffusion coefficient value of 10-10 cm²/s it takes hours to be close to equilibrium with a 20 µm diameter grain material after a surface concentration change related to the potential step. Consequently, the potential scan rates to be used will be in the range of a few mV per hour (µV/s).
One can take advantage of such slow kinetics and of the large possibilities of the digital systems presently available for recording systematically the chronoamperometric responses at every potential step. Using this “Step Potential Electrochemical Spectroscopy” it is possible to discriminate easily between the various processes that can be involved in intercalation electrode materials, and to observe intermediate metastable redox states too [5-7].
Thus, the potential-controlled methods, that correspond to investigating the extensive response of a system (charge variations) to the application of an intensive perturbation (applied potential changes) appear particularly suitable for basic studies of the behavior of intercalation electrode materials.
Galvanostatic methods, on the contrary, are much more devoted to the long-term behavior of systems being cycled.
In EC-Lab software, all these types of measurements can be performed through two protocols, Galvanostatic Cycling with Potential Limitation (GCPL) and Potentiodynamic Cycling with Galvanostatic Acceleration (PCGA).
In addition to the basic parameters that make the measurements presented above possible, these protocols have many additional parameters related to the specificity of intercalation electrodes and their use in batteries. This can be seen on the various windows of the protocols.
One can mention the fact that the progress of the redox reactions can be controlled and monitored either in terms of charge, or of the active electrode material’s molar amount, or once given its molar mass, of its amount, of the mass of the intercalated species and of its change of ionization degree upon intercalation. Also the determination of equilibrium potential when reaching a preset slope for the open circuit potential vs. time is also available as well as the possibility of preparing extensive cycling studies with various loop conditions.
Results
The following example deals with an accurate determination of the phase diagram of the LiCoO2 system upon lithium deintercalation, using the PCGA protocol. This compound is presently the active material of the positive electrode of several commercial “Lithium-Ion” batteries, the negative electrode material being carbon, either as graphite or as a coke. The initial LiCoO2 / C couple is the discharged state of the battery. Charging the battery corresponds to oxidation of the LiCoO2 by lithium removal, with concomitant reduction of the negative carbon electrode, by formation of well defined intercalation compounds in the case of graphite (lithium goes between the graphene layer in several steps with final formations of LiC12 below 120 mV vs. Li0–Li+ and then LiC6 below 80 mV). As the potential of the negative electrode depends on its degree of reduction, a basic study of the positive electrode material requires either the use of a reference electrode (a piece of lithium in the electrolyte as indicated previously [8]) or designing a battery with metallic lithium as negative electrode.
Upon lithium deintercalation, LiCoO2 experiences several structural phase changes and reaches a state, which is not thermodynamically stable at high oxidation level. Thus, its use as a reversible electrode in batteries is limited to partial deintercalation. This limit appears as a limit potential upon charge, usually close to 4.1 V between positive and negative terminals in commercial batteries (the reason for the floating mode at the end of a galvanostatic charge).
The first steps of these structural changes have been studied for some time [9]. Work has been carried out looking at the structural changes above the reversibility limit [10,11] which was still an open question and studies have been performed to look at its dependence with alloying the Co [12].
The experiment presented here has been carried out on a small LiCoO2 / Li metal cell, in thin foils form, using an electrolyte that resists oxidation up to about 5 V vs. Li0–Li+ [13]. The positive electrode contained 9.8 mg of active material, corresponding to a nominal charge of 2.684 mA·h for complete lithium removal (the theoretical capacity of total Li removal is 274 mA/g for LiCoO2). Setting a very long duration for the potential levels (100 h), the occurrence of the potential steps was in fact governed by reaching the current value that was set as “acceleration” current, here Imin = 0.135 mA, corresponding to a galvanostatic regime close to C/20 (13.7 mA/g). We chose a potential step amplitude of 5 mV to obtain a high resolution on the incremental capacity voltammogram. The potential limit of the first sequence was initially set to 5.245 V.
There was no acceleration current in the second sequence, which means that the potential would be kept at 2.250 V for the duration that was set at 100 h too.
All these conditions lead to the chronoamperometric response shown in the Figs. 1 and 2.
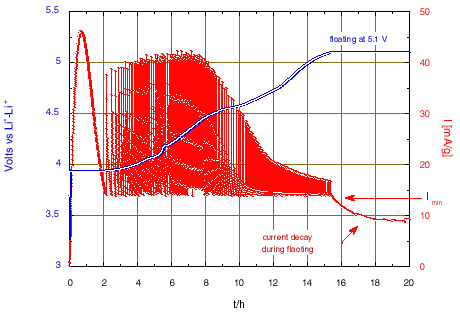
Figure 1: Li deintercalation from LiCoO2 using step potential electrochemical spectroscopy. (+5 mV potential steps with C/20 equivalent Imin).
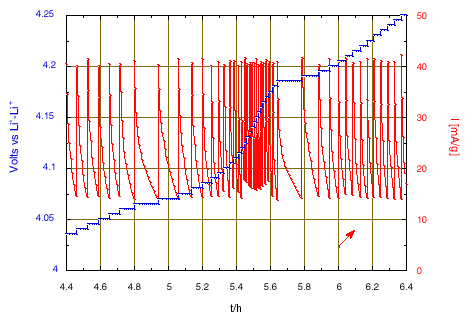
Figure 2: Zoom on the chronoamperometric responses when crossing the intermediate phase domain around 4.15 V and x = 0.5.
The large peak of current that initiates when reaching 3.935 V is due to the nucleation and growth of the new phase under the driving force of the over voltage from the equilibrium two-phase potential. After 2 hours, once the transformation is almost complete the potential scan will continue. A change of scanning rate is observed after almost 5 hours, when reaching 4.05 V, due to crossing the domain of existence of an intermediate phase. Then, much smaller changes of slope were observed. The slope increase from 4.8 V is attributed to parasitic current due to oxidation of the electrolyte, becoming large at higher potential. Thus, the condition has been modified to limit the final floating potential to 5.1 V. The current decay observed during the floating corresponds to a tendency towards equilibrium, but with a constant current contribution due to the progress of the electrolyte oxidation.
The incremental capacity is reported as –dx/IdVI per volt, for sake of comparison with other experiments; i.e. the charge increment values, obtained by integration of chronoamperometry for each potential level (“Process Data” function, selecting “Compact” option) have been normalized to the total charge for x = 1, also taking into account the potential step amplitude.
This representation gives clear evidence of the limits of the various phase diagram domains . The first phase transition occurs close to 3.935 V, then enters and leaves the existence domain intermediate is observed at 4.060 (2) and 4.180 (2) V, respectively (the potentials where the oxidation peaks initiate). Note, in this domain the minimum of incremental capacity occurs exactly for x = 0.5 which corresponds to perfect lithium ordering. Finally, the last phase changes which are still discussed occur in the 4.45 to 4.6 V range, before the last increase of -dx/IdVI due to occurrence of the electrolyte oxidation above 4.8 V.
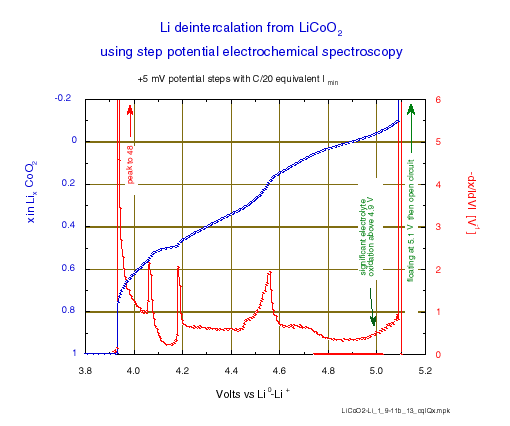
Figure 3: Li deintercalation from LiCoO2 using step potential electrochemical spectroscopy (+5 mV potential steps with C/20 equivalent Imin).
Compared to an incremental capacity determination made by differentiation of the content vs. the potential (-dx/IdVI) from a galvanostatic experiment at a C/50 rate [8], such a step potential electrochemical spectroscopy determination gives better results, with narrower and higher peaks of incremental capacity at every transition (48 V-1 compared to 29 at the first transition, and above 2 compared to 1.5 at the domain limits of the ordered phase). And this is obtained in a much shorter time: the effective duration of the total lithium removal was reached in less than 13.5 hours in this experiment. The effective average rate of a step potential spectroscopy experiment with a current acceleration is effectively of the order of 50% to 70% larger than the rate , which corresponds to the acceleration current.
This time saving was emphasized by Thompson [14] and can be understood easily: assuming that for a diffusion-controlled process the decay of the current after a potential step is close to an exponential decay (that is true for a RC), within one time constant of the duration of the potential level, the current decays to about 37 % of its initial value, whereas the charge that has been passed is close to 63 % its limit value. Thus, the effective equivalent rate is 1.7 times larger than the rate corresponding to the current reached before a new potential step.
All of these results emphasize the interest of the “GCPL” and “PCGA” protocols, for studying batteries and battery electrode materials.
Note: The figures presented in this section are do not originate from the EC-Lab graphics application, but have been plotted with the KaleidagraphTM application, from EC-Lab exported Text files.
References
- M. Armand, Intercalation Electrodes, in “Material for Advanced Batteries”, D.W. Murphy, J. Broadhead and B.C. Steele (Eds.), Plenum, NY. (1980) 145.
- W. Weppner and R.A. Huggins, J. Electrochem. Soc., 124, (1977) 1569.
- C.J. Wen, B.A. Boukamp, R.A. Huggins and W. Weppner, J. Electrochem. Soc., 126, (1979) 2258.
- A.H. Thompson, J. Electrochem. Soc., 126, (1979) 608.
- Y. Chabre, J. Electrochem. Soc., 138, (1991) 329.
- Y. Chabre, NATO ASI Series, B305, (1992) 181.
- Y. Chabre and J. Pannetier, Prog. Solid. St. Chem., 23, (1995) 1.
- A. Blyr, C. Sigala, G. Amatucci, D. Guyomard, Y. Chabre and J.M. Tarascon, Electrochem. Soc., 145, (1998) 194.
- J.N. Reimers and J.R. Dahn, J. Electrochem. Soc., 139, (1992) 2091.
- T. Ohzuku and A. Ueda , J. Electrochem. Soc., 141, (1994) 2972.
- G. Amatucci, J.M. Tarascon, and L.C. Klein, J. Electrochem. Soc., 139, (1996) 1114.
- J.M. Tarascon, G. Vaughan, Y. Chabre, L. Seguin, M. Anne, P. Strobel and G. Amatucci, J. Solid State Chem., 147, (1999) 410.
- M. Morcrette, G. Vaughan, Y. Chabre and J.M. Tarascon, unpublished.
- A.H. Thompson, Rev. Sci. Instrum., 54, (1983) 229.
Revised in 07/2018


