

Meniscus and beam position effects on measurement stability EkkO – Spectroscopy – Application Note 28
Latest updated: March 1, 2023Introduction
Circular dichroism (CD), the commonly used technique for chiral analysis, refers to the differential absorption between left and right circularly polarized light. It is often used for assigning the secondary structures of proteins and determining enantiomeric purities in asymmetric syntheses, both of which require the ability to do the measurements in a high- throughput fashion1,2.
Traditional CD spectrometers use a horizontal light path which require transferring sample into a cuvette for measurement. Even though this process is expedited when robotic liquid handling systems are coupled to a conventional CD spectrometer, the cuvette must be cleaned between measurements. This is still a laborious and time-consuming process.
The EKKO™ CD Microplate Reader is a vertical CD spectrometer that turns the measuring light beam from the horizontal direction to vertical allowing for the use of a computer-controlled XY stage so that CD signals are read from a well plate directly.  The EKKO™ CD Microplate Reader thus eliminates the time-consuming processes of 1) transferring the contents from each well of a well plate into a cuvette, and 2) cleaning the cuvette between measurements, significantly increasing productivity, as much as 100-fold with respect to conventional CD systems coupled to a robot1,2,3.
Several types of commercial well plates are available for use with the EKKO™ CD Microplate Reader. Well plates with an optical glass bottom can be used in the visible spectral region, while those with a fused silica bottom can be used in the ultraviolet and visible spectral regions. Finally, those made from solid fused silica provide the best durability and performance.
Regardless of which well plate is used, the top surface of a solution will form a meniscus in the well. It is expected that the presence of the meniscus would affect the CD measurement results.  Fig. 1. Presumed effects on the light path as a function of the meniscus in a well. For any given volume in a well plate, the light path through that solution will be dependent upon its location in the well due to the meniscus. At a minimum, this position will determine both the effective path length and the degree of scatter of the light as it passes through the meniscus, both of which meaningfully affect the signal observed when measuring CD.
In this note, we present CD measurements of (+)-camphorsulfonic acid (CSA) with purposely displaced beam positions from the optical center of the well to address the effects of beam alignment in conjunction with a meniscus.
RESULTS
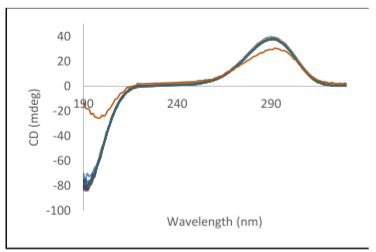
Fig. 2. CD spectra of an aqueous CSA solution at varying distances from the optical center of the well. 200 µl of CSA (Sigma) at 0.2 mg/ml was in well #F10 of a solid fused silica 96 well plate (Hellma). Eleven of the twelve CD spectra were measured at beam displacements between -1.0 mm and 1.0 mm in 0.2 mm steps from the center the well along the Y axis. One (brown) was displaced 2 mm along both the X and Y axes. To save time, only raw spectra were collected (blanking not performed) and the shortest integration times were used. No efforts to reduce the noise were made.
Figure 2 illustrates the gross effects of beam path displacement on the CD spectra of CSA. As expected, significant misalignment from the optical center of the well, the brown trace, pointedly affects the CD signature of the CSA due to the meniscus; in this case, not only was signal lost but the 290.5/192.5 ellipticity ratio was only 1.64, well below the accepted norm for CSA of 2.0 to 2.1 observed for the remaining spectra.
The remaining CSA traces were stable and not substantially different across the 2-mm area of the well examined when the beam path was purposely displaced in 0.2 mm steps along the dimension of the Y-axis. Similar results and indications were obtained in the X-axis dimension (data not shown). This suggested that the usable area inside the well for positioning the beam is approximately 2 mm along both the X- and Y-axes of the EKKO™ CD Microplate Reader.
 Fig. 3. Differential spectra of CSA at varying distances from the optical center of the well. Replots of the data in figure 1 as differential spectra (spectra – mean spectra) from 250 to 330 nm.
To examine if small changes are apparent in the raw CD spectra obtained as function of displacement of the beam path from the optical center of the well, the data for the eleven spectra from figure 2 that demonstrated little variability were replotted as differential spectra (spectra – mean spectra). Figure 3 illustrates that there are indeed alterations in the CD signal as a function of position which were missed in the original examination of the data.
While eight of the eleven differential CD spectra shown in Figure 3 are within the noise, the three differential spectra associated with the largest displacements, ≥ 0.8 mm (green, red, and blue) display significant differences in their respective signals further supporting that that large displacements will cause alterations in the CD signal as originally anticipated.  Fig. 4. % signal deviation as a function of distance from the optical center of the well. 200 µl of CSA (Sigma) at 0.2 mg/ml was in well #F10 of a solid fused silica 96 well plate (Hellma). The CD signal was collected for 30 displacements of the beam path along the X-axis at 290 nm. Each position was 0.1 mm incrementally further away from the optical center of the well. Data is plotted as the % deviation from the mean.
To get a better handle on the effective useable area in each well, we collected the CD signal of CSA at 290 nm with smaller incremental displacements (0.1 mm) from the optical center of the well. Figure 4 illustrates that if the beam path is with in ± 0.8 mm of the optical center of the well along the X-axis dimension, the CD signal will only deviate 1% percent at most. In the dimension of the Y-axis, the beam path had a 0.9 mm tolerance to obtain a similar 1% deviation threshold (data not shown).
DISCUSSION
We have purposely used unusually large beam displacements to test their effect on CD measurement in a well plate and the presence of a meniscus. With normal operation of the EKKO™ CD Microplate Reader, the positioning errors for well plates are well below the 0.1 mm displacements used in this study. The stage used in the EKKO™ CD Microplate Reader has reproducibility of 5 µm and an accuracy of better than 100 µm according to the manufacturer specifications
While the meniscus created by a solution in the well of a well plate alters the CD signature of a sample, the results presented in Figures 2, 3, and 4 demonstrate that slight misalignment of the measuring beam have no considerable adverse effects on the measurement. Presumably, this due to the use of only approximately 20% of the surface area of the well given a beam diameter of 3 mm compared to a well diameter of 6.6 mm.
While the EKKO™ CD Microplate Reader is the only commercially available vertical CD spectrometer, the Siligardi group at Diamond Light Source UK, has pioneered vertical CD using synchrotron radiation (B23 beamline) for high-throughput well plate applications4. They concluded that the meniscus and associated small misalignments between the center of the well and the measuring beam have no practical effect on CD measurements as well.
SUMMARY
1. The EKKO™ CD Microplate Reader has typical positioning errors below 100 µm and a reproducibility of 5 µm.
2. The EKKO™ CD Microplate Reader tolerates misalignments of up to 0.8 mm in the beam position without effecting the results.
3. Under normal operations, the meniscus and small misalignments between the measuring beam and the center of a well have no adverse effect on CD measurements using EKKO™ CD Microplate Reader.
References
1) Metola, P., Nichols, S.M. Kahr, B., and Anslyn, E.V., Well plate circular dichroism reader for the determination of enantiomeric excess. Chem. Science. 5, 4278-4282 (2014).
2) Jo, H.H., Cao, X. You, L., Anslyn, E.V., and Krische, M.J., Application of highthroughput enantiomeric excess optical assay involving a dynamic covalent assembly: parallel asymmetric allylation and ee sensing of homoallylic alcohols. Chem. Science. 6, 6747-6753 (2015).
3) Fielder, S., Cole, L., and Keller, S., Automated Circular Dichroism spectroscopy for medium throughput analysis of protein conformation. Anal. Chem. 85, 1868-1872 (2013).
4) Hussain, R., Javorfi, T., Rudd, T. R., and Siligardi, G., High-throughput SRCD using multi-well plates and its applications. Nature, Sci Reports 6, 38028 (2016).


