

Measurement of electrochromic bandshift at 520 nm with real-time scatter correction at 546 nmLife Sciences – Application Note 4
Latest updated: June 13, 2024Introduction
The formation of a transmembrane electric field during photosynthesis leads to absorbance peak shifts of certain pigments in the antenna of photosynthetic organisms. These field-indicating absorbances were first reported in 1968 by Junge and Witt [1], and are a direct observation of the trans-thylakoid voltage so their rates indicate current, i.e. they are simultaneously a molecular voltmeter and an ammeter. Since the field-indicating absorbance is only dependent on the formation of the field, the response is immediate, and the voltage and current are indicated linearly and can be calibrated to yield absolute values.
The field-indicating absorbance changes are induced via electrochromism. For a pigment in solution, electrochromism has three effects, (1) changes in angle between the transition dipole and the field orientation, or the orientation effect, (2) direct effects of the field on the transition dipole moment, or transition moment effect, and (3) shift in absorption band, or bandshift effect. For protein-bound pigment in a membrane, the bandshift effect describes the behavior, and a simplified model is seen in figure 1. In panel A, a pigment is excited by a photon and is raised to an excited energetic state. In the absence of an external voltage this will occur with a wavelength equal in energy to the electronic transition, however if either of the ground or excited states have differences in dipole moment or polarizability, then an external field will change the energy of the transition. The corresponding excitation wavelength will likewise change. Figure 1B demonstrates the effect on the peak position for a situation in which the pigment has been electrochromically shifted to a lower transition energy, i.e. red shifted.
In the case of a sample in which the baseline was collected in the absence of an electric field, and then measured in the presence of the field, the result is the green trace in Fig. 1B. In photosynthetic organisms this field is rapidly established in the light and diminished in the dark and can therefore be used as an inherent probe of many membrane voltage dependent phenomena. This “bandshift effect” is the cause of the “field-indicating absorption changes”, and is commonly referred to as the electrochromic shift (ECS) in photosynthesis research.
 Figure 1: Basis of the electrochromic shift (ECS). A) Simplified diagram of the formation of the excited state for a membrane embedded pigment in the absence (left) and presence (right) of an external electric field. B) Effects of energy shift in panel A on the absorption spectra of the pigment in the absence (dashed black line) of an external field, analogous to the dark state, or in the presence of an external field (solid red line) as in the “light” state for photosynthetic membranes. The difference of these traces is shown in the solid green and is the ECS signal.
Experimentally, the effects of ECS can be verified by the addition of ionophores or uncouplers. These compounds allow ions to freely pass across phospholipid membranes and lead to the collapse of ion-dependent membrane voltages. Only field dependent absorptions will be diminished by the addition of these compounds.
Using ECS, information on a wide variety of fundamental actions in photosynthesis has been obtained and is reviewed in [2], including: (1) A photodependent electric field normal to the thylakoid membrane; (2) The field is created via movement of electrons from inside-to-outside of the membrane; (3) The electron movements are caused by photosystem I and photosystem II; (4) the electron donors for the photosystems are inside the membrane and the terminal acceptor is outside; (5) A stepwise pathway of electron transfers coupled with proton pumping provided evidence for the establishment of the Z-scheme.
However, there are complicating factors for the use of ECS in plants and green algae. The signal is typically measured between 515–520 nm, and there are significant spectral overlaps with absorbances originating from other phenomena. On timescales < 3 μs, the formation of carotenoid triplet states overlap and on long timescales (seconds to minutes) there are structural rearrangements in the thylakoid membranes due to pH changes that lead to scattering differences [3] and changes to the carotenoids via the xanthophyll cycle.
The major contributor to the artifact is the scattering component, but it can be accounted for as the effect is spectrally broad. Kramer et al. [4] have resolved the components of ECS and scattering at 520 nm and 545 nm. Using these coefficients, we can separate the signals and calculate the contribution of each component separately. Using the BiLEDs for the JTS-100 or the Smart-Lamp with the JTS-150, these data can be collected nearly simultaneously for a real-time correction in a single sequence with no repeats or averaging required.
Methods
A JTS-150 (SpectroLogiX, Knoxville)* The JTS-150 is the latest Joliot-type spectrometer developed by SpectroLogiX for near-simultaneous multiple absorbance/fluorescence measurements and is the successor to the JTS-10 and JTS-100 was setup in kinetic dI/I mode (absorption kinetics) using the 520 nm and 546 nm channels of the smart-Lamp (The smart lamp can also measure absorbances at 554 nm, 563 nm, 573 nm, 705 nm, and 740 nm as well as probe fluorescence using a 470 nm fluo. probe). Please note that this measurement is also possible using the ECS BiLED accessory for a JTS-100 (SpectroLogiX, Knoxville & BioLogic, Grenoble) with the first centered at 520 nm and FWHM of 10 nm, and the second is centered at 546 nm with FWHM of 10 nm. Kinetic traces were collected with 5 µs offset between the 520 nm and 546 nm detection channels. The preamplifiers of both detectors were placed in 1000x gain and 1” diameter 6 mm thick BG-39 filters (Schott, Mainz) were placed in front of each detector diode. Each detection was a 10 μs integration. The following sequence was used:
40(100msD[1;2]25ms)TG[3000uE]20us{350us, 100,5s,D[1;2]}H20us{350us,200,15s,D[1;2]}
The sample was mature leaf from a creeping fig vine (Ficus pumila) grown under ~20 uE PPFD. Sample was dark adapted for 10 minutes prior to measurement. Measurement was taken at room temperature with actinic source of 3000 uE with 630 nm LED source. No averaging or other manipulations were performed on the raw data.
The 520 nm and 546 nm traces were scaled by the coefficients determined in [4] to deconvolute the ECS signal and scattering component and also recover the full intensity of the ECS component and scattering artifact.
Results
Figure 2A contains the raw data from the dark adapted leaf in a dark-light-dark regime. The initial period contains the baseline in the dark from -5–0 s and is used to correct the baseline. The next 5 s are illuminated with 630 nm actinic light at 3000 uE. During this time, there is a rapid onset of apparent absorbance in both the 520 nm and 546 nm. Although the 546 nm signal is dominated by the artifact, the total amplitude of the artifact is only about 25–30% of the ECS signal [4]. The result is that the overall shape of the curve measured at 546 nm resembles the 520 nm curve during the actinic period. The dark recovery has larger relative differences between the 520 nm and 546 nm signals, which is caused by the rapid decay of the ECS signal which is disproportionately faster than the changes in the scattering curve. The result of these rate differences are especially apparent in the region from 5–7 s in figure 2A.
Once the signals are fully separated (figure 2B), the traces at 520 nm and 546 nm which have two components each are much more easily interpreted. According to [4], the 546 nm signal is the sum of 93% scattering and 49% ECS, since the scattering contribution is fairly constant during the actinic period, it causes the 546 nm curve to be dominated in shape by the ECS signal but with a reduced amplitude over most of the actinic period. Since the scatter effect does not have rapid onset as the ECS does (see figure 3A), the initial value is 48% relative to the value of the ECS signal at 520 nm (figure 2A, the first 20 ms). This is in good agreement with the expected value of 49%; at most other points on the curve these comparisons cannot be made as the scattering signal vs. time is nonzero at nearly all other points. The one exception is at t=5.3643 s, at this point the scattering curve is equal to zero and the raw data of the 546 nm trace should again be 49% of the 520 nm trace. Indeed, the values are -0.00539 and -0.00262 for 520 nm and 546 nm traces respectively, which is a ratio of 48.6% 546 nm curve to be dominated in shape by the ECS signal but with a reduced amplitude over most of the actinic period.
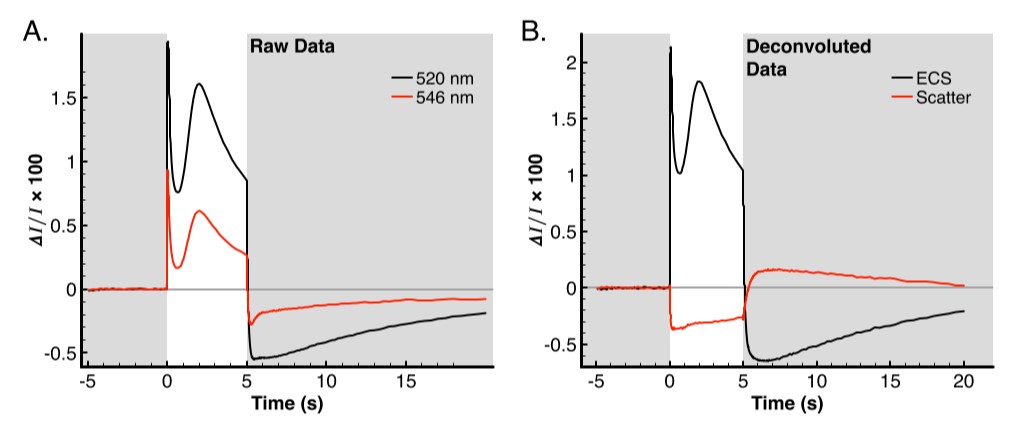 Figure 2: ECS Data collection and correction. Plot backgrounds colored grey represent actinic lights off and white backgrounds represent actinic lights on. A) Raw data collected at 520 nm (black trace) and 546 nm (red trace). B) Data from panel A, with deconvolutions applied from [4], ECS signal is represented in black and the scattering artifact is shown by the red trace.
Since the scatter effect does not have as rapid of an onset as the ECS does (figure 3A), the initial value is 48% relative to the value of the ECS signal at 520 nm (figure 2A, the first 20 ms). This is in good agreement with the expected value of 49%; at most other points on the curve these comparisons cannot be made as the scattering signal vs. time is nonzero at nearly all other points. The one exception is at t=5.3643 s, at this point the scattering curve is equal to zero and the raw data of the 546 nm trace should again be 49% of the 520 nm trace. Indeed, the values are -0.00539 and -0.00262 for 520 nm and 546 nm traces respectively which is a ratio of 48.6%.
The initial onset of ECS is shown in figure 3A. Data points are displayed to make clear that there are many observations during the rising phase of the ECS at this actinic intensity. There is a period of ~25 ms following the illumination in which the ECS signal rises rapidly, but there is nearly no change in the scattering signal. The scattering trace begins to drop below its dark-adapted baseline value and achieves a minima within 150 ms. The lumen must become acidified before the onset of processes such as induction of qE or membrane rearrangements resulting in scattering changes. Following the initial 20 ms, additional proton pumping from the b6f complex adds more to the ECS before the ATPase begins to relieve the proton gradient as at longer timescales the rates eventually come into equilibrium.
Figure 3B details the method of Joliot and Joliot [5] to estimate the rate of photochemical charging of the membrane. At the moment the actinic light is removed, the photochemistry leading to the trans-membrane voltage is eliminated and the slope difference reveals the rate of photochemistry or Rph. Once Rph is divided by the corresponding absorbance change for moving a single charge across the membrane, then the rate is obtained. Single-turnover conditions with a saturating pulse less than 10 µs can be used to obtain this value. This measurement was not performed in this work, but if reasonable literature values are used such as in [5], then we obtain a rate of 90 s-1 in the case of figure 3B.
Discussion
ECS has been widely useful in the study of plants and green algae, and has allowed observation of many fundamental steps in photosynthesis (see introduction). Further insights are also available from ECS such as the PSI/PSII ratio. In single turnover conditions (relative to PSI, i.e. <10 µs saturating flash), the ratio of PSI/PSII can be measured by using the initial amplitude with and without PSII inhibited. ECS has also been critical in the study of linear and cyclic electron flow in leaves and total photosynthetic ion flux by monitoring the slope difference highlighted in the inset of figure 3B repeatedly during brief intervals where the actinic light is turned off, known as dark interval relaxation kinetics. Alternative electron flows have also been studied by ECS, such as the activity of plastoquinol terminal oxidase in Ostreococcus via ECS and specific inhibitors for PTOX [6]. All of these applications are improved by the correction of the ECS signal with measurement at 520 nm and 546 nm simultaneously. The scattering signal may also be of interest to some researchers as it is an easily observable measure of thylakoid rearrangement in vivo.
 Figure 3: Dark/Light and Light/Dark transitions. Portions of the plot with grey background have no actinic illumination, portions with whit background are illuminated at 3000 uE. A) Initial Dark-to-Light transition period with ECS signal represented by black trace and scattering signal in red. B) Light-to-Dark transition (trace colors as in panel A). Inset is at adequate zoom to see slope differences which are approximated by dashed blue lines.
Plants and Chlamydomonas have been extensively studied at 520 nm, but other alga and diatoms have ECS signals at other wavelengths. If you have interest in making kinetic measurements of ECS in another organism, SpectroLogiX can prepare an LED/filter combination to allow you to work with these organisms. Please contact us with any specific requirements for your work.
References
[1] W. Junge and H. T. Witt, “On the ion transport system of photosynthesis — Investigations on a molecular level —,” Zeitschrift für Naturforschung B, vol. 23, pp. 244–254, Feb. 1968.
[2] H. T. Witt, “Energy conversion in the functional membrane of photosynthesis. Analysis by light pulse and electric pulse methods: The central role of the electric field,” Biochimica et Biophysica Acta (BBA) – Reviews on Bioenergetics, vol. 505, pp. 355– 427, Mar. 1979.
[3] S. W. Thorne, G. Horvath, A. Kahn, and N. K. Boardman, “Light-dependent absorption and selective scattering changes at 518 nm in chloroplast thylakoid membranes.,” Proceedings of the National Academy of Sciences, vol. 72, pp. 3858–3862, Oct. 1975.
[4] D. M. Kramer and C. A. Sacksteder, “A diffusedoptics flash kinetic spectrophotometer (DOFS) for measurements of absorbance changes in intact plants in the steady-state,” Photosynthesis Research, vol. 56, pp. 103–112, Apr. 1998.
[5] P. Joliot and A. Joliot, “Cyclic electron transfer in plant leaf,” Proceedings of the National Academy of Sciences, vol. 99, pp. 10209–10214, July 2002.
[6] P. Cardol, B. Bailleul, F. Rappaport, E. Derelle, D. Beal, C. Breyton, S. Bailey, F. A. Wollman, A. Grossman, H. Moreau, and G. Finazzi, “An original adaptation of photosynthesis in the marine green alga Ostreococcus,” Proceedings of the National Academy of Sciences, vol. 105, pp. 7881–7886, June 2008.


