

In-situ electrochemical study of LiFePO4 electrodes by quartz crystal microbalance Battery – Application Note 68
Latest updated: May 31, 2024Check out our partners to perform coupled measurements: https://biologic.net/partners
Introduction
The LiFePO4 (LFP) electrode is widely used in Lithium Ion Batteries (LIB) as a practical positive electrode. It is considered to be one of the safest, toughest and most cost-effective positive electrodes for lithium batteries available today.
It has a stable electrochemical response, expressed by sharp intercalation and deintercalation peaks during voltammetric cycling. The relatively low working potentials of the LFP provide an electrochemically stable potential window in which only Li insertion/extraction processes take place without the contribution of parasitic processes associated with high operation potentials.
In this application note, first we will use QCM to characterize the coating in air and in the electrolyte. Then we will present how the QCM can be used to study Faradaic insertion and deinsertion processes occurring in a LFP electrode under voltammetric cycling.
Electrode fabrication
A commercially available carbon-coated LFP powder was mixed with 10% PVDF binder and dissolved in N-methyl pyrrolidone (NMP). The obtained slurry was sonicated during 10 min for improved homogenization.
The resulting suspension was deposited onto the top gold surface of a 5 MHz 14 mm Ti/Au polished quartz crystal sensor using gas-assisted spraying [1].1
Characterization of the clean and coated sensors in air
QCM measurements at different harmonics or overtones were performed on the clean and the coated sensors to check the quality of the coating. One must ensure that the coating is rigid and thin.
Theory
a. Effect of crystal thickness increase
The QCM measures the resonant frequency by performing an admittance measurement at frequencies around the theoretical fundamental resonant frequency of the sensor of interest.
A clean sensor consists of an AT-cut quartz disk with two Au electrodes on each side. Figure 1 shows the typical resonance curves for two different sensors: on the right, a sensor with a thickness $d_1$ and on the left, a sensor with a thickness $d_2$ with $d_2>d_1$.
We observe in Figure 1 that the value of the real part of the admittance forms a peak around the resonant frequency $f$. The half width at half maximum or half bandwidth $\Gamma$ is a measure of the dispersion of the resonant frequency.

Figure 1: Typical resonance curves of two crystals of different thicknesses. $f_{01}$ and $f_{02}$ correspond to a sensor of thickness $d_1$ and $d_2$, respectively.
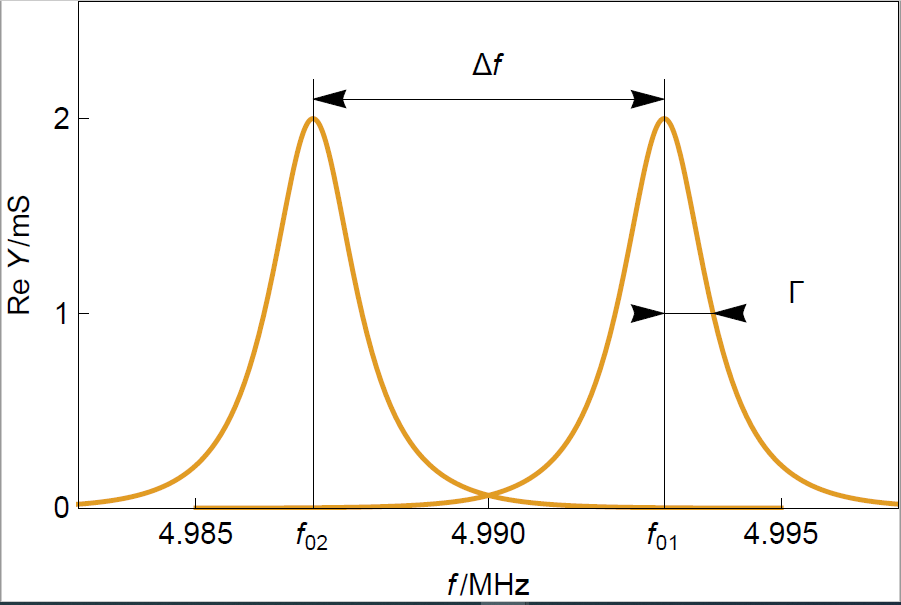
The resonant frequency of the crystal with a larger thickness is smaller because the shear wave produced by the sinusoidal electrical modulation travels over a larger distance $d_2$ with the same speed $v_\text{c}$. The resonant frequency is equal to:
$$f=\frac{v_c}{2d}\tag{1}$$
With $v_\text{c}$ the speed of sound in the crystal in m.s-2 and $f$ the resonant frequency in Hz of a sensor with a thickness $d$ in m.
Since the material is the same for both sensors there is no change of amplitude or dispersion. Measuring the resonant frequency change gives a measure of the thickness change.
b. Effect of a rigid film.
The effect of a film on the Dissipation measurement resonance of the quartz depends on its thickness and its rigidity or elasticity. Here we will deal with the case of a rigid or elastic thin film and an elastic thick film.
“Rigid” means that the acoustic wave will propagate elastically in the film, without any energy loss.
“Thin” means that the film’s mechanical properties (shear wave modulus and density) can be approximated by the quartz crystal properties. Consequently, the wave velocity in the film is the same as in the crystal.
A “thick” film means that its properties have to be accounted for and that the velocity of the wave is different in the film compared to that of the crystal.
The rigid thin film
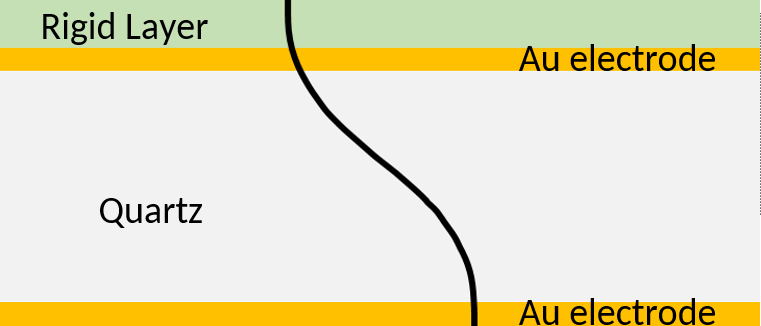
Adding a rigid thin film on top of the sensor has the same effect as an increase of the quartz thickness. It is illustrated in Figure 2. The wavelength of the standing wave $\lambda=2d$ is effectively increased. The black line represents the instantaneous maximum shear displacement. In this case the displacement of the rigid layer follows the displacement of the crystal.

Figure 2: Acoustic standing wave across the sensor with a rigid layer. The wavelength of the standing wave is increased.
The change of the resonance curve is the same as in Figure 1. The frequency shift $\Delta f_\text{n}$ can be used to determine the film thickness or mass using the Sauerbrey equation:
$$\Delta f_n=-n \frac{2f^2_{0,n}}{\sqrt{\mu_\text{q}\rho_\text{q}}}\Delta m_\text{a}\tag{2}$$
With $n$ the harmonic number, $f_\text{0,n}$ the resonant frequency at the $n^th$ harmonic in Hz, $\mu_\text{q}$ the shear elastic modulus of the quartz in kg.m-1.s-1 or Pa.s, $\rho_\text{q}$ the quartz density in kg.m-3, and $\Delta m_\text{a}$ the real mass of the film in kg.m-2.
The rigid thick film
If the frequency shift $\Delta f_\text{n}$ is over 2% of the initial resonant frequency $f_\text{0,n}$, the film should be considered thick. The Sauerbrey relationship cannot be used anymore as the film properties need to be accounted for.
A more complicated relationship needs to be used involving the wave velocity in the quartz and in the film [2]:
$$\Delta m_\text{a}= \frac{\rho_\text{f}\upsilon_\text{f}}{2\pi f}\text{arctan}\left(\frac{\rho_\text{q}\upsilon_\text{q}}{\rho_\text{f}\upsilon_\text{f}}\text{tan}\left(\pi\frac{f_0-f}{f_0}\right)\right)\tag{3}$$
With $\Delta m_\text{a}$ the areal mass of the film in kg.m-2, $\rho_\text{f}$ and $\rho_\text{q}$ the density of the film and the quartz, respectively in kg.m-3, $\upsilon_\text{f}$ and $\upsilon_\text{q}$ the wave propagation velocity in the film and the quartz, respectively in m.s-1, $f_0$ and $f$ the resonant frequency of the quartz and the quartz + film composite resonator in Hz.
c. How to know if a film is rigid or not?
Dissipation measurement
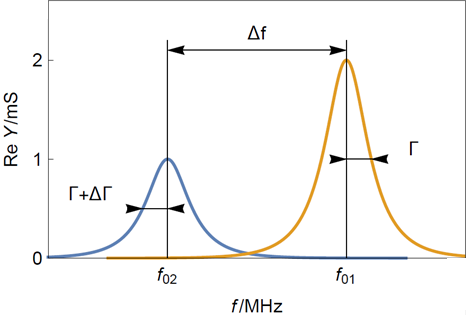
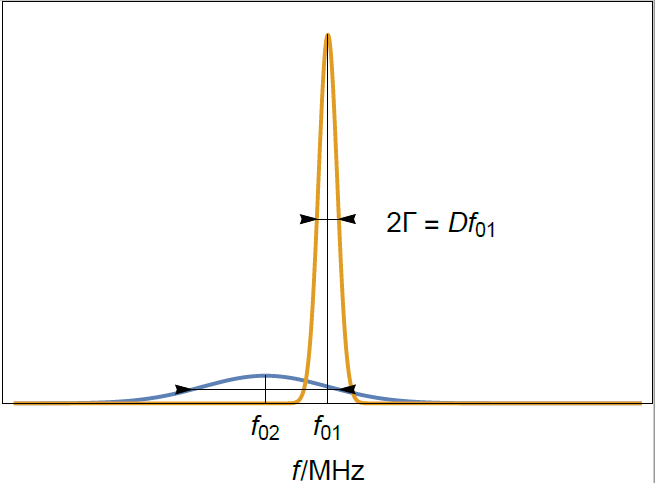
To evaluate the rigidity or elasticity of the film, one should look at the change of half bandwidth shift $\Delta \Gamma$ in Hz (Figure 3) between a clean and a coated sensor. A bandwidth shift is considered small when it is smaller than the resonant frequency shift $\Delta f$ as it is the case in 0.
Instead of the half bandwidth change, the dissipation factor change $\Delta D$, expressed as a ratio and not a frequency, is measured using:
$$\Delta D=\frac{2\Delta\Gamma}{f_{01}}\tag{4}$$
With $f_{01}$ the initial fundamental frequency in Hz as shown in Figure 1 and Figure 3.

Figure 3: Typical resonance curves of (yellow) a bare and clean quartz crystal sensor and (blue) a sensor with a thin rigid film. $f_{01}$ is the initial resonant frequency of the bare sensor and $f_{02}$ the resonant frequency of the rigidly coated sensor. Note that the half-bandwidth increase is much smaller than the frequency shift.
In the case of dissipation measurement, the criterion for rigidity is:
$$\frac{\Delta D}{\Delta f}\lt\lt\frac{1}{f_{01}}\tag{5}$$
Measurements at harmonics
With QCM systems, you also have the possibility to measure the resonant frequencies at higher harmonics rather than the fundamental one. In the field of acoustic waves, only odd harmonics are measured.
Measuring at harmonics give another way of ensuring that the film coating the bare electrode is rigid. If the value $\Delta f_\text{n}/n$ is constant for each harmonic, the film can be considered rigid.
Measuring at higher harmonics provides other advantages:
- The value $f_\text{n}/n$ where $f_\text{n}$ is the resonant frequency at the $n^\text{th}$ harmonic, should theoretically be constant with the harmonic order. However it has been noted [3] that it was constant only after the 3rd harmonic, which then can be considered to be a more reliable measurement of the resonant frequency.
- Finally, dissipation and resonant frequency shift are needed at several harmonics when one needs to study and characterize viscoelastic homogeneous thin films, particles, molecules or conformation. More details can be found in [4].
Results
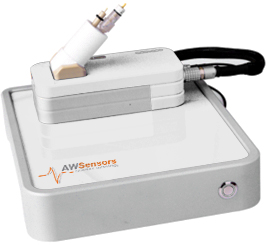
The bare and coated quartz crystals were introduced in a EQCM in-batch measurement cell connected to the QCM platform (Figure 4). The cell temperature is set to 23 °C by using a Temperature Control Unit. Once the temperature is stabilized, the admittance spectrum was measured in air for all odd harmonics from the fundamental frequency to the 13th harmonic.
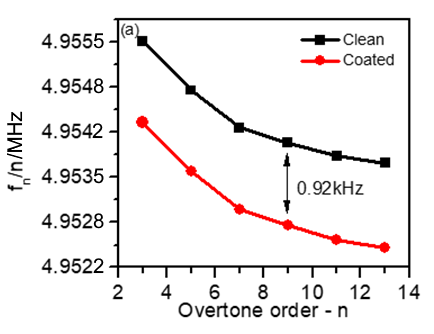
Figure 5a shows a decrease in the frequency shift with the harmonic order for both bare and coated sensors. This response gives a preliminary indication of the good quality of the tested sensors [3].

Figure 4: EQCM in-batch measurement cell connected to the QCM platform.
It can also be noted that the frequency shift between the bare and the coated sensor seems to be constant for all harmonics, which is a proof that the coating is rigid.
Figure 5b shows $\Delta D_\text{n}$ vs. $\Delta f_\text{n}/n$, for each harmonic. $\Delta f_\text{n}/n$ is almost independent from the harmonic order as it was already seen in Fig. 2b.
Furthermore, a relatively small dissipation factor change is recorded for the first four harmonic orders (1st, 3rd, 5th, 7th).
As mentioned above, a dissipation change $\Delta D$ is considered small when $\Delta D/ \Delta f \lt\lt 1/f_{01}$.
Not only does the dissipation change seem small but it is also constant with the harmonic order, which is a proof that the coated film is rigid.
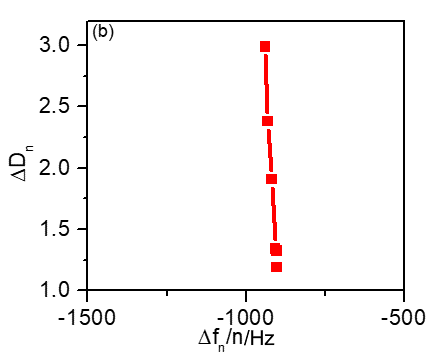

Figure 5: (a) Frequency vs. harmonic order distribution obtained for bare gold (black) and for LFP-coated (red) quartz crystals. (b) 10-6 $\Delta D_\text{n}$ vs. $\Delta f/n$ harmonic normalized changes.
For higher harmonic orders (9th, 11th,13th), a larger dissipation shift can be seen which may be attributed to the multilayer character of the electrode coating [1].
QCM Characterization of the coated sensor in 1 M Li2SO4
Theory
Until now, we have studied resonators in air. In air, the shear acoustic wave produced by the electrical sinusoidal modulation on the piezoelectric quartz crystal propagates elastically in the sensor and in the coating, as was shown by the results in Figure 2.
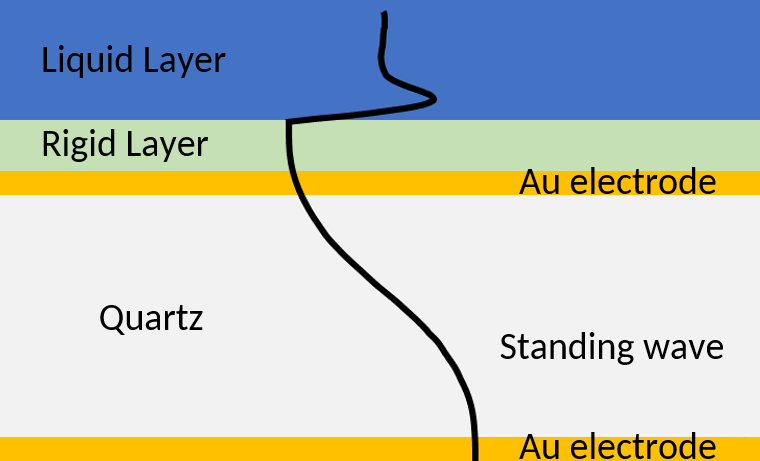
If the sensor is in liquid, the acoustic wave dissipates in the liquid medium. The amplitude of the wave decays away from the sensor/liquid interface (Figure 6).

Figure 6: Acoustic standing is a crystal with a rigid coating and a Newtonian liquid layer. The presence of the rigid coating increases the wavelength of the wave, which then dissipates in the semi-infinite liquid layer.
The presence of a liquid layer on top of the crystal affects not only the resonance frequency of the sensor but also its dissipation, to an extent that is comparable to the frequency shift (Figure 7).
The Kanazawa plots [5] describe the effect of the presence of a semi-infinite liquid on the resonant frequency change of a crystal with a neat, flat surface. The resonant frequency change is now a complex value with two terms:
$$\frac{\Delta f_n^*}{(n\rho_\text{L} f^2_0)}=\frac{-\delta}{\sqrt{\mu_\text{q}\rho_\text{q}}}=\frac{j\delta}{\sqrt{\mu_\text{q}\rho_\text{q}}} \tag{6}$$
where $\Delta f_\text{n}^*$ is the complex resonant frequency change at the $n$th harmonic order due to liquid loading in Hz, $n$ harmonic order, $\rho_\text{L}$ the liquid density in kg.cm-3, $f_0$ the resonant frequency of the free (dry) quartz in Hz, $\delta$ the penetration depth of the wave in the liquid in nm, $\mu_\text{q}$ the elastic modulus of the quartz in Pa, $\rho_\text{q}$ the quartz density in kg.cm-3 and $j$ the imaginary number such as $\sqrt{j}=-1$.
The penetration depth is defined as:
$$\delta=\left(\frac{\mu_\text{L}}{\pi n\rho_\text{L}f_0}\right)^{1/2}\tag{7}$$
where $\mu_\text{L}$ is the dynamic viscosity of the liquid in Pa s.

Figure 7: Typical resonance curves of a sensor in (yellow) and (blue) in a Newtonian liquid. Note that the half-bandwidth increase is comparable to the frequency shift.
Results
After the initial evaluation of the coating in the air, an electrolyte solution (1 M Li2SO4) was injected into the sensor cell. Both the reference (Ag/AgCl) and counter electrodes (Pt) were inserted in the cell and connected to a BioLogic SP-200 potentiostat.
The working electrode i.e. the sensor was left at its Open Circuit Potential (OCP), which was equal to around 0.2 V vs. Ag/AgCl. The frequency and dissipation factor changes were monitored simultaneously to the OCP as a function of time.
When the crystal’s potential stabilized, its admittance spectrum at all the harmonic orders was measured.
The changes in the frequency ($\Delta f$) and resonance half bandwidth ($\Delta \Gamma$) due to the immersion of the coated crystal into the electrolyte solution were calculated by subtracting the data measured in the air from that measured in the solution (valid for a rigid coating only). $\Delta f$ and $\Delta \Gamma$ were then normalized by the harmonic order and compared to the theoretical Kanazawa plots [5].
The deviation of the experimental points (related to the different harmonic orders) from the Kanazawa straight lines implies hydrodynamic solid-liquid interactions between the electrolyte solution and the coated electrode of complex morphology. The use of the appropriate hydrodynamic models provides a unique information about the morphological character of the coating [6,7].
The experimental data are represented in Figure 8 by solid circles. The solid straight lines relate to the Kanazawa-type frequency and resonance width changes for ideally flat surface of the neat crystal. The values of the solution density $\rho_\text{L}$ and viscosity $\nu_\text{L}$ used for the calculation of Kanazawa plots were 1098 kg/m3 and 1.69 cP, respectively [8].
In Figure 8, the characteristic frequency change offset of the coated electrode from that of the Kanazawa plots for flat surface is mainly due to hydrodynamic solid-liquid interactions of the solid matrix of the electrode with the contacting solution. The porous structure parameters of the electrode can be retrieved using the appropriate hydrodynamic modelling [6].

Figure 8: Normalized half-bandwidth ($\Delta \Gamma/ n$) and frequency shift ($\Delta f/n$) as a function of the penetration depth measured for the coated sensor (solid circles) vs. theoretical Kanazawa predictions for an ideally flat surface (black lines).
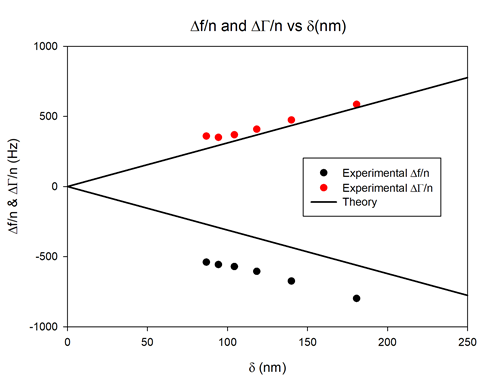
Moreover, the characteristic downward deviation of frequency change and upward deviation of dissipation change from the Kanazawa plot at higher harmonics (11th, 13th) tends to indicate a small viscoelastic contribution of the coating [6].
Insertion study using QCM measurements
Theory
It is assumed that the only electrochemical reaction taking place during cycling is the following:
$$\text{Li}^+ +\text{e}^- + \langle \, \rangle \rightleftharpoons\langle \text{Li} \rangle\tag{8}$$
Where $\langle \, \rangle$ represents an insertion site in the positive electrode and $\langle \text{Li} \rangle$ an inserted Li metallic atom. The forward direction of the reaction corresponds to the discharge of a full battery, where the LFP is the positive electrode and the backward direction, the charge.
We can then define the theoretical Faraday frequency shift $\Delta f_\text{f}$, which is the frequency shift due to the faradaic insertion of Li+ in the electrode and is derived from the Faraday law:
$$\Delta f_\text{f}=\frac{M_\text{Li}C_\text{SC}Q}{n_\text{e}FA}\tag{9}$$
where $M_\text{Li}$ is the Li molar mass (equal to 7 g.mol-1), $C_\text{SC}$ is the Sauerbrey constant equal to 56.6 x 10⁶ Hz.cm2.g-1, $Q$ is the charge in C, $n_\text{e}$ is the number of transferred electrons per intercalated cation, $F$ is the Faraday constant (96485 C.mol-1), and $A$ is the active electrode surface (0.78 cm2).
Results
The sample was polarized from OCP to 0.6 to 0 V and back to 0.6 V vs. Ag/AgCl for 10 cycles at 5 mV/s.
It can be seen in Figure 9a that the shift $\Delta f/n$ for all $n$ practically coincides with the theoretical Faraday frequency change (dotted black line). The deviations from the theory that can be seen before each insertion, that is to say right before $\Delta f/n$ starts decreasing, can be due to several factors:
- irreversible reactions
- interactions between the electrode and the liquid
- imperfection of the electrode/Au interface.
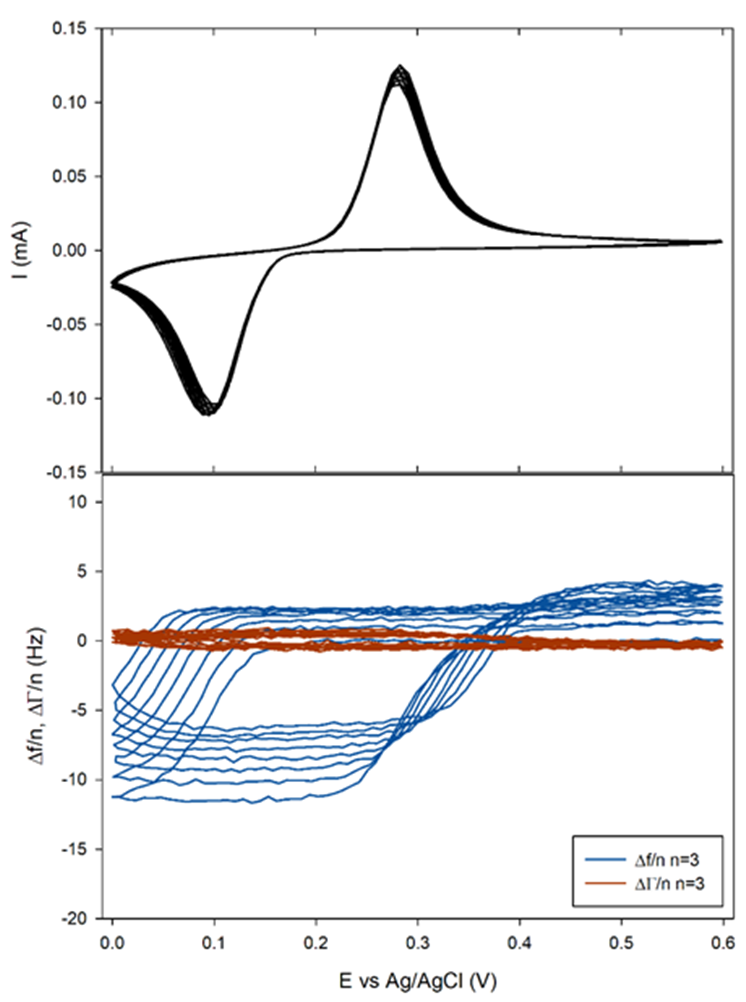
Figure 9b and Figure 10b show that the related change in $\Delta \Gamma/n$ appeared to be close to zero or at least with a magnitude 10 times smaller than $\Delta f/n$. This result tends to show that the insertion of Li+ occurs in a gravimetric mode. This, in turn, implies that the change of the electrode potential during the electrode cycling negligibly affects the pristine electrode porosity, roughness and viscoelasticity.

Figure 9: a) Frequency and b) half-bandwidth shift measured during CV. The theoretical Faraday frequency shift has been added to the top graph as a dotted black line.
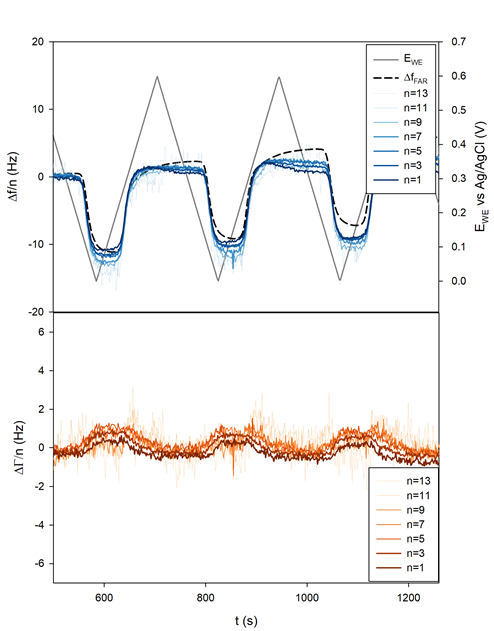

Figure 10: a) Current and b) 3rd harmonic frequency and half-bandwidth vs. Ewe
Conclusions
Using a QCM, it was possible to follow the frequency change related to the faradaic insertion of Li+ into an LFP electrode. After the characterization of the coating and the effect of its immersion into the electrolyte, it was shown, using resonance frequency and resonance width changes measured at multiple harmonics, that the insertion process was mainly gravimetric and did not seem to change the morphology of the electrode and the viscoelastic nature of the electrode/electrolyte interface.
This application shows how QCM can be used to help better understand the insertion processes of charged species in battery materials.
Acknowledgments
This application note has been prepared with the collaboration of Prof. Michael Levi and Dr. Netanel Shpigel from the Department of Chemistry at Bar-Ilan University, Israel.
References
- Shpigel, S. Sigalov, M. D. Levi, T. Mathis, L. Daikhin, A. Janes, E. Lust, Y. Gogotsi, D. Aurbach, Joule 2 (2018) 1.
- Pauporté, D. Lincot, in : Microbalance à cristal de quartz, Techniques de l’Ingénieur, (2006) P 2 220.
- Reviakine, A. N. Morozov, F. F. Rossetti, J. Appl. Phys. 95 (2004) 7712.
- Johannsmann, in : The Quartz Crystal Microbalance in Soft Matter Research, Springer, (2015) 27.
- K. Kanazawa, J. G. Gordon II, Anal. Chem. 57 8 (1985) 1770.
- Shpigel, M. D. Levi, D. Aurbach, Energy Storage Materials 21 (2019) 399.
- D. Levi, N. Shpigel, S. Sigalov, V. Dargel, L. Daikhin, D. Aurbach, Electrochim. Acta 232 (2017) 271.
- Cartón, F. Sobrón, S. Bolado, J.I. Gerbolés, J. Chem. Eng. Data 40, 4 (1995) 987.
Revised in 04/2024
Scientific articles are regularly added to BioLogic’s Learning Center:
To access all BioLogic’s application notes, technical notes and white papers visit our online page:
https://biologic.net/documents/
[1] Even though it seems in the worlds of acoustics, the term “overtones” is preferred. In this paper, since we deal with integer multiples of the resonant frequencies, the term “harmonics” is preferred. https://en.wikipedia.org/wiki/Overtone


