

Investigation of the diffusion of ferricyanide through porous membranes using the SECM150 Scanning Probes – Application Note 19
Latest updated: June 13, 2024Abstract Scanning ElectroChemical Microscopy (SECM) allows spatial resolution of porous membranes in x, y, and z directions. Using the SECM150, the diffusion of [Fe(CN)6]3- through a polycarbonate membrane with 12 µm pores was measured. By changing the probe to membrane distance quantitative analysis of diffusion through the membrane was performed. To view the entire application note please click the download button below.
Introduction
Scanning ElectroChemical Microscopy (SECM) has the ability to provide spatially resolved, rather than globally averaged, measurements of a system. This is particularly useful for measurements of membranes, and other porous systems through which diffusion of a species can occur. In these cases SECM provides not only spatial resolution in the x,y direction, but can also allow investigation in z. This gives perspective on the diffusion of the species of interest through the pore, and within the electrolyte after leaving the pore.
At present there have been limited studies of gas diffusion electrodes by SECM [1]. However growing interest in fuel cells and metal-air batteries means the use of SECM in future such measurements is likely. The measurement of simple porous membranes provides background understanding of the concepts and experimental requirements of measuring more complex diffusion systems. Furthermore these experiments demonstrate the usefulness of SECM in diffusion measurements.
The use of the SECM150 to measure diffusion of the [Fe(CN)6]3- redox mediator through a porous membrane will be demonstrated in this note.
Method
The SECM150 was used to measure the diffusion of the [Fe(CN)6]3- redox mediator through the 12 µm pores of a 8 µm thick Whatman® CycloporeTM polycarbonate track etched membrane. The membrane was mounted in a home-built diffusion cell for measurement. The lower portion of the cell contained a donor solution of 0.1 mol·L-1 K3[Fe(CN)6] in 0.1 mol·L-1 KCl, while the upper portion contained a receptor solution of 0.1 mol·L-1 KCl only, illustrated in Fig. 1. This allowed tip collection measurements of the membranes to be performed. The confined size of the diffusion cell meant separate Pt wire Quasi-Reference and Counter Electrodes (QRE and CE respectively) were used. A 10 µm Pt capillary type UltraMicroElectrode (UME) was used.  Figure 1: Illustration of the layout of the diffusion cell used in the measurement of the 12 µm pore polycarbonate membrane Prior to performing any area scan measurements a Cyclic Voltammogram (CV) was performed at the UME, at a scan rate of 0.1 V·s-1. The resulting CV is shown in Fig. 2. Using this CV it was possible to determine if the [Fe(CN)6]3- species was able to freely diffuse through the membrane without any experimental intervention, and the relative magnitude of the current expected in the subsequent experiments. During these measurements no effort was been made to remove dissolved oxygen, therefore the effect of oxygen is seen in the curving baseline of the CV. When compared to a previous CV run 10 min prior, however, it can be seen that as more [Fe(CN)6]3- diffuses through the membrane this effect is diminished. Both CVs were taken away from the pore openings and, therefore, do not reflect the maximum current measured at the UME tip, it. While using [Fe(CN)6]4- instead would move the reaction of interest completely outside of the potential region of oxygen reduction, this species has been seen to cause more obvious, and quicker electrode fouling, and therefore use of [Fe(CN)6]3- was continued.
  Figure 2: CVs of [Fe(CN)6]3- after diffusion into the receptor solution. The blue curve was measured 10 min after the yellow curve. In order to determine the z position of the area scan measurements an approach curve was performed with the probe biased at -0.65 V, Fig. 3. The kink at the end of the curve (at -42 µm) indicates the membrane has been touched, therefore the point marked with the gold diamond is used as the z position. A large area, low resolution scan was performed in order to quickly assess the membrane surface, and determine the best pore to focus on. Ideally the pore should be well separated from others, and give a high contrast compared to the surrounding region. Based on this the pore centered at (130 µm, 144 µm) was selected. An approach curve to the center of the pore was performed, and the z position adjusted to account for any height change at this position. This new z value is the z = 0 µm point for all further measurements.
 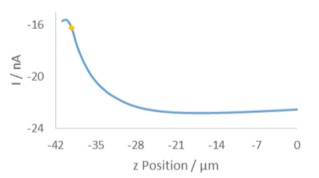 Figure 3: Approach curve performed at the pore of interest. The gold diamond marks the z position of the measurements. Once an appropriate pore was selected area scans were performed over it at varying heights. All area scans were performed over a 50 x 50 µm² area with 1 µm steps in x and y, and took approximately 11.5 min to run. Scans were performed using the SECM150 sequencer options (available in the New Experiment Menu). After performing each area scan the probe was automatically moved up in z by 1 µm relative to its last position. This was performed as an automated loop with 11 total iterations, Fig. 4.
  Figure 4: The SECM150 sequencer allows automation of experimental procedures. In the sequence used in this note 11 loops were run, in which an area scan was performed, followed by a relative movement in z of 1.0 µm away from the sample surface. The effect of moving the probe away from the membrane surface was analyzed using an x cross section measured at the most central y position of the pore of interest in the first (z = 0 µm) measurement. The x cross section was then measured at the same y position for each subsequent measurement.
All area maps were processed using Gwyddion
Results
Initially the SECM150 was used to quickly measure a large area of the membrane to determine the locations of candidate pores. To help visualize these pores the resulting 41 x 41 step measurement was interpolated to a 101 x 101 step measurement, improving the resolution of the original image. Both maps are shown in Fig. 6. Based on the interpolated image the pore centered at (130 µm, 144 µm), marked in the interpolated map with the black dashed circle, was focused on. As a 50 x 50 µm² area was measured to ensure all changes could be seen this also allowed assessment of the pore at (115 µm, 158 µm). The same area was measured in 11 sequential scans from z = 0 µm to z = 10 µm as shown in Fig. 5. These images show that the edges of each individual pore become less distinct with increasing probe-sample distance.  Figure 6: 50 x 50 µm² area scans of the same two pores measured in an automated sequence at varying z heights above the pore. z/µm = 0 (a), 1 (b), 2 (c), 3 (d), 4 (e), 5 (f), 6 (g), 7 (h), 8 (i), 9 (j), and 10 (k).
 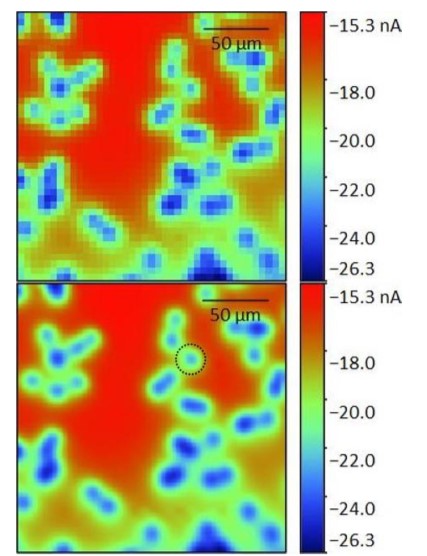 Figure 6: Original 41 x 41 point (top) and interpolated 101 x 101 point (bottom) area scan of a 200 x 200 µm² area of the porous membrane. The interpolated image was used to determine the pore of interest (black dashed circle) and the subsequent 50 x 50 µm² region. Furthermore the maximum current decreases with increasing probe-sample distance. Both of these features are a result of the diffusion of the [Fe(CN)6]3- species from the pore. [Fe(CN)6]3- diffuses from the pore to give rise to the highest concentration directly over the opening of the pore. The diffusion of the species occurs radially out from the pore, perpendicularly to the concentration contours shown in Fig. 7. As the probe moves further from the surface of the pore the concentration of the [Fe(CN)6]3- species decreases causing a decrease in the current measured. Finally, as the probe-sample distance increases, the concentration contour lines begin to overlap leading to the loss of distinct edges seen in the area scan.
 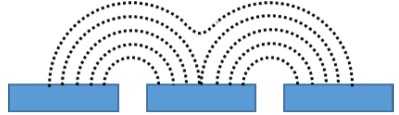 Figure 7: Illustration showing the concentration contours of the redox mediator. The concentration increases as the distance to the pore decreases. The effect of measuring the membrane at increasing probe-sample distances can be further analyzed by looking at x cross sections of the two pores, Fig. 8. In both cases increasing the probe-sample distance causes a decrease in the current measured over the pore, and an increase in the FWHM of the peak measured over the pore. Fig. 7 shows that as the probe moves over the pore with a small probe-sample distance there is a greater concentration change, over the same distance than at larger probe-sample separations. Furthermore, the maximum concentration is greater at smaller probe-sample separations. This results in the tall, sharp current peaks seen at small probe-sample distances, and short, broad current peaks at large probe-sample distances.
Based on the area scans and resulting cross sections it is apparent that in order to best resolve diffusion through a pore the probe-sample distance should be as small as possible. This allows the probe to measure not only the highest concentration over the center of the pore, but also the largest change in concentration on moving a given distance from the center in the x and/or y direction, leading to an image with the sharpest contrast between the pore, and the rest of the membrane.  Figure 8: x-cross sections of the pore centered at (130 µm, 144 µm) (top), and (115 µm, 158 µm) (bottom). These are composed of cross sections taken at all z positions from 0 to 10 µm from the surface. The direction of increasing z distance is marked.
Quantitative Analysis
It is possible to use the SECM measurements performed here to carry out analysis of the diffusion through the pore. Based on this work the concentration of [Fe(CN)6]3- at the surface of the pore, the collection efficiency, its rate of transport from the pore opening, and its rate of transport in the pore can be determined.
Concentration
By using the maximum current measured at the probe at the pore opening it is possible to determine the concentration of [Fe(CN)6]3- at the pore opening. This is found using the following equation, which assumes the limiting current has been measured during the area scan measurement, the system is at a steady state, and the temperature is constant [2]:
$$C = \frac{i_t}{2\pi nFDr_t}$$(1)
Where C is the concentration in mol·cm-3, it is the current measured at the probe in A, n is the number of electrons transferred (in this case 1), F is the Faraday constant, D is the diffusion coefficient (7.2 x 10⁻⁶cm²·s-1 for [Fe(CN)6]3- [3]) and rt is the radius of the probe in cm. Using Eq. 1 the concentration of [Fe(CN)6] 3- at both pore openings is found to be 9.8 x 10⁻³ mol·L-1.
Collection Efficiency
To better understand the concentration of [Fe(CN)6]3- measured at the pore opening it is useful to know the collection efficiency during the measurement. To find this the theoretical maximum current based on diffusion between the donor and receptor compartments, id, is found, and compared to it. Eq. 2 below can be used to determine id [4-6]:
$$i_d = \frac{2\pi nFDr_p^2(C_d – C_r)}{\pi r_p + 2I}$$(2)
Where rp is the radius of the pore, Cd is the concentration of [Fe(CN)6]3- in the donor solution in mol·cm-3 , Cr is the concentration of [Fe(CN)6]3- in the receptor solution in mol·cm-3 , and l is the length of the pore, which is taken to be the thickness of the membrane. Using this equation the maximum current is -45 nA. This means the collection efficiency is just under 50%. This difference is expected and likely arises because a number of assumptions are made, including that the pore is perfectly cylindrical throughout, there is no uncertainty in the membrane thickness, that all [Fe(CN)6]3- emerging from the pore is collected by the probe size, which is unlikely due to the tip size, and that the probe-sample separation is exactly 0 [4].
Transport
Using the peak current measured by the probe above the pore it is also possible to determine the rate of transport from the pore opening, Ω, and in turn the rate of transport through the pore, N. These are determined with the following equations, assuming a steady-state and constant temperature [2]:
$$\Omega = 2r_p\frac{i_t}{\pi nFr_t}$$(3)
$$N = \frac{\Omega}{A_p}$$(4)
Where Ap is the cross-sectional area of the pore. In using these equations it is assumed that rt<<rp, and therefore the probe does not affect the diffusion of [Fe(CN)6]3- through the pore. Though in this note rt and rp are similar in size it is common to use Eq. 3 regardless in order to approximate the rate of transport from the pore opening [7]. It must also be assumed the pore is disc shaped, and that the membrane is only permeable to [Fe(CN)6]3- at the pore when using Eqs. 3 and 4 [2]. Using Eqs. 3 and 4 [Fe(CN)6]3- is shown to have a rate of transport, Ω, from the pore opening of 1.7 x 10⁻¹³ mol·s-1, and a rate of transport through the pore, N, of 1.5 x 10⁻⁷ mol·s-1cm-2. These values are the same for both pores analyzed.
Scott et al [6] have previously studied the diffusion of the same species through a 7 um pore in mica, finding it to diffuse an order of magnitude faster. There are, however a number of experimental differences in these two experiments, which may lead to the difference in magnitude seen. Most notable, however, is the fact that in their work Scott and colleagues made just a single pore in their mica, allowing the diffusion to behave ideally. The commercial membrane here, however, has 1 x 10⁵ pores/cm² , which are spaced randomly across the pore. This means that pores can be relatively close together, leading to non-ideal behavior. When using these transport equations, it is assumed the pores are spread far apart, and therefore these equations are most accurate when the distance between pores is larger than the size of the probe [2]. When this is not the case, as seen here the approximation becomes less accurate. In these cases, however, it can be useful for comparing individual pores in the same membrane and the effect of changes of individual variables, e.g. electrolyte concentration, on the overall system. Furthermore, if a multispecies electrolyte is used, these approximations can be made based on SECM measurements in order to compare the rates of diffusion of the different species at the membrane [5].
Conclusion
The use of the SECM150 to measure diffusion of [Fe(CN)6]3-through a pore has been shown. It was possible to take advantage of the fast scan rates available using the SECM150 to quickly screen a larger area of the membrane to determine the best area to focus on. Utilizing the sequencing options in the SECM150 software it was then possible to automate the measurement of 11 consecutive area scans over the pore of interest to investigate the effect of increasing the probe-membrane distance.
References
1. P. Schwager, D. Fenske, G. Wittstock, J. Electroanal. Chem. 740 (2015) 82-87.
2. H. S. White, F. Kanoufi, in: A. J. Bard, M. V. Mirkin (Ed.), Scanning Electrochemical Microscopy: Second Edition, CRC Press, Boca Raton (2012) 233.
3. S. J. Konopka, B. McDuffie, Anal. Chem. 42 (1970) 1741-1746.
4. C. E. Gardner, P. R. Unwin, J. V. Macpherson, Electrochem. Comm. 7 (2005) 612-618.
5. E. R. Scott, H. S. White, J. B. Phipps, J. Membr. Sci. 58 (1991) 71-87.
6. E. R. Scott, H. S. White, J. B. Phipps, Anal. Chem. 65 (1993) 1537-1645.
7. B. D. Bath, R. D. Lee, H. S. White, E. R. Scott, Anal. Chem. 70 (1998) 1047-1058.


