

Investigation of an interdigitated array electrode using ic-SECM Scanning Probes – Application Note 13
Latest updated: June 13, 2024Abstract
ic-SECM has been used to measure a gold InterDigitated Array (IDA) provided by ELISHA Systems Ltd [1]. Using ic-SECM the electrochemical nature of the IDA electrode without interference from the sample topography, or tilt, is shown.
Introduction
ic-SECM has been used to measure a gold InterDigitated Array (IDA) provided by ELISHA Systems Ltd [1]. Using ic-SECM the electrochemical nature of the IDA electrode without interference from the sample topography, or tilt, is shown.
IDAs are microband electrodes composed of two sets of interlocking conductive fingers. Each set of conductive fingers can be controlled separately by connection to a conductive pad. The separate control of these fingers is key to the widespread use of the IDA electrodes in sensor applications as this allows them to be biased separately, helping to increase their sensitivity compared to other electrode geometries [2-3]. It can be important to understand fully how these arrays act electrochemically, making them of interest for SECM studies [4].

Figure 1: Schematic of the IDA electrode (not to scale). The area of interest is composed of two sets of 20 gold fingers, 20 µm wide and separated by 10 µm.
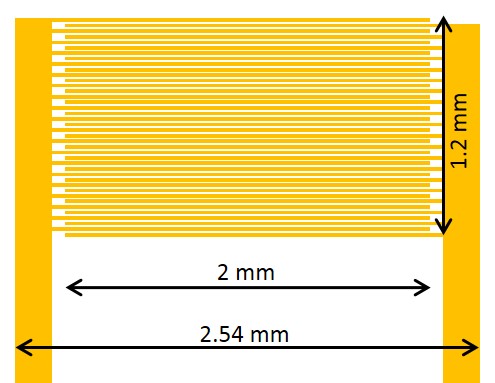
A schematic of the IDA electrode used in this work is shown in Fig. 1. It is composed of a gold layer which lies up to 250 nm above the insulating silicon/silicon oxide chip. The gold is patterned to form two sets of 20 interlocking gold fingers. Each finger is 20 µm wide, and is separated from the next by 10 µm. Electrical contact can be made to either set of gold fingers through a pair of gold pads.
Ic-SECM
The response recorded by the probe in SECM is related to both the electrochemical nature of the sample and the probe-sample distance. This relation means a typical SECM measurement is a combination of both the sample electrochemistry and topography. Much work has been done to separate the two signal components, including the relatively recent development of ic-SECM. [5] Unlike in traditional SECM measurements where the probe remains at an absolute z value throughout, in ic-SECM the probe maintains a specific distance from the sample. In ic-SECM a piezo is used to vibrate the probe in z, this vibration is damped as the probe approaches the sample surface, acting as a mechanical control mechanism. More information on ic-SECM can be found in the ic-SECM tutorial [6] and in AN#6 [7]. Information on the related technique of ic-ac-SECM can be found in AN#11 [8].
Method
An IDA electrode was mounted in the SECM Shallow µTriCellTM so as to allow it to be electrically biased. To do this it was mounted on copper tape and a connection between the copper tape and the pads of the electrode was made with silver conductive paint. The copper tape and silver conductive paint were then insulated from the electrolyte by painting them with a thin layer of ethyl cyanoacrylate. This ensured that corrosion products from the copper tape did not foul the electrolyte.
Using the ic-SECM470, the IDA electrode measured in 5 x 10⁻³ mol L-1 KI/100 x 10-3 mol L-1 KCl solution by ic-SECM. A 10 µm Pt probe, SCE reference electrode and a Pt sheet counter electrode were used. Before any measurements were performed the IDA electrode was cycled sufficiently negative (-1.25 V vs. SCE and lower) to remove any contaminants from the electrode surface. The probe was biased at 0.65 V to oxidise the I– species. The IDA sample was biased at 0 V to avoid electrode fouling. The step size used was 5 µm. The probe was vibrated at 450 Hz (about 15 Hz below resonance), with an amplitude of 0.2 µm. The control percentage was 75 %. Once collected the maps were processed using the Gwyddion data analysis software, [9] and 3D maps were produced in 3DIsoPlot from the resulting comma-separated value text file. More information on Gwyddion and 3DIsoPlot can be found in TN#10 [10] and AN#12 [11] respectively.

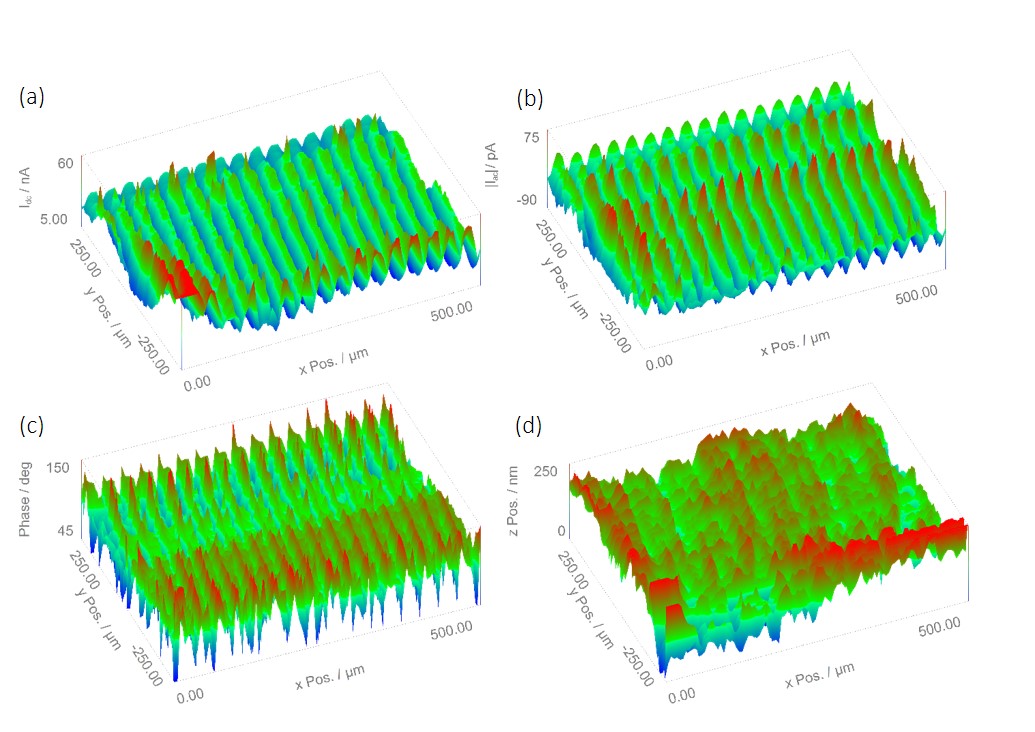
Figure 2: ic-SECM maps measured for an IDA electrode in 5 x 10⁻³ mol L-1 KI/ 100 x 10-3 mol L-1 KCl. (a) The dc current signal. (b) The ac current signal. (c) The ac phase signal. (d) The sample topography.
Results
When performing ic-SECM measurements four different data types are always acquired. (1) The probe dc current. This is the current measured by the probe due to the conversion of the redox mediator, as expected in all dc-SECM measurements. (2) The probe ac-current. This results from the probe vibrating in z. (3) The probe phase. This is the phase change of the ac-signal with regards to the waveform driving the piezo oscillation. (4) The sample topography. This is the z position of the probe based on its control to the surface. It is also possible for the user to acquire the sample dc current, and/or a VAUX signal, though these were not of interest in this experiment. Figure 2 shows the four main data types for the IDA electrode. It can be seen that all four data types give rise to the peaks and troughs expected on going from the gold to the silicon surfaces.

Figure 3: A cross section of the dc current taken at y=0 µm. The yellow lines indicate the points where the peak separation was measured.
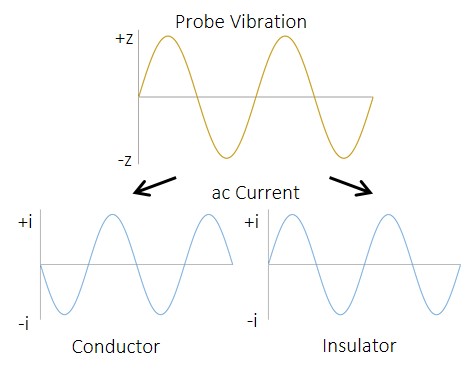

Figure 4: Schematic of the effect of probe vibration on the ac current measured over a conductor and an insulator.


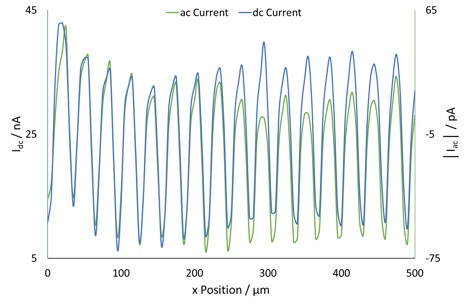
Figure 5: An overlay of the dc current and ac current cross sections at y=0 µm.
The probe dc-current is shown in Fig. 2a. This clearly shows bands of areas of increased electrochemical activity, as anticipated for the conductive gold bands separated by insulating silicon. When a cross section of the dc-current is taken, as in Fig. 3, the spacing between each peak in current is measured as 30 µm. This is as expected for a 20 µm wide gold band with a 10 µm separation. On moving from gold to insulating silicon the gold finger still aids in the regeneration of I– for detection by the tip, causing a higher current than expected over insulating silicon alone, and the gradual decrease in conductance seen here [4].
The ac signal resulting from tip vibration in an ic-SECM experiment is composed of two components, the ac-current amplitude and the phase shift between the ac current and the tip vibration. The measurements resulting from these are shown in Fig. 2b and Fig. 2c respectively. The ac signal from ic-SECM provides the user with more information about their sample than could be achieved by dc-SECM alone. The extra information from the ac signal comes from the way it is affected by the different surface types. When the probe is over a conductive surface the current measured increases as it moves closer to the surface, producing an ac signal like that shown in Fig. 4 during its vibration. The opposite occurs during its vibration over an insulating surface.
Figure 6: An overlay of the dc current and ac phase at y=0 µm. The dashed lines indicate the width of the high phase angle signal.
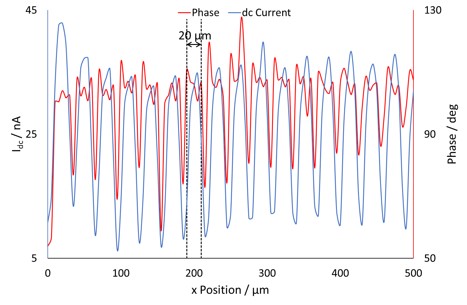
When a dc and ac current cross section are compared, Fig. 5, a direct relationship between the two is seen. Overlaying the phase angle on the dc current, as in Fig. 6, shows that the areas of high phase angle correspond to those of high dc-current, indicating these are a result of the conductive gold bands. Furthermore it can be seen that unlike for the other signals where there is a gradual change from conductor to insulator due to the effect of the gold on the mediator, for the phase change there is a dramatic drop on going from conductor to insulator. Unlike either the ac- or dc-current measurements the ac phase measurement is completely independent of the magnitude of current measured, and the sample topography. The ac phase signal is instead related only to the conductive nature of the sample, i.e. whether the surface is a conductor or an insulator. As can be seen in Fig. 4 the ac current signal when the probe is over a conductor is 180° out-of-phase with that over an insulator. In Fig. 2c distinct stripes of higher, and lower, phase angles can be seen. Whereas for the ac- and dc-current signals only a 30 µm peak-to-peak separation could be determined, it can now be seen that the conductive portion is 20 µm in width. The ability to measure an ac signal in ic-SECM allows it to provide more detail about the conductive nature of the sample than would be possible using dc-SECM alone [12 – 13].
ic-SECM also allows independent information about the topography of the sample to be determined, something which is not possible in standard dc-SECM measurements. The topography image, Fig. 2d, demonstrates the sensitivity of the ic-SECM technique with topography changes of just a few hundred nm detected. The measured topography changes are on a similar scale to the height of the gold layer above the insulating silicon/silicon oxide chip.
Conclusion
The use of ic-SECM to measure a gold IDA electrode has been demonstrated. By using ic-SECM more information than would be possible through standard SECM can be collected. Most importantly with ic-SECM the dc current and topography of the IDA electrode have been measured simultaneously, allowing for a separation of the two signals. Investigation of the IDA sample with ic-SECM also allows secondary information, such as the phase of the resulting ac current to be measured, providing information on the conductive nature of the sample. Through the use of ic-SECM a more in-depth understanding of the sample can be achieved than with standard SECM techniques.
Acknowledgements
The gold interdigitated array measured in this work was provided by Professor Paul Millner ELISHA Systems Ltd director, and Professor of Bio-nanotechnology at the University of Leeds.
References
- ELISHA Systems Ltd www.immunosensors.com
- Szunerits, L. Thouin, in : C. G. Zoski (Ed.), Handbook of Electrochemistry, Elsevier B.V., Amsterdam (2007) 391.
- E. Cohen, R. R. Kunz, Sensors and Actuators B 62 (2000) 23-29.
- P. Filice, M. S. M. Li, J. D. Henderson, Z. Ding, J. Phys. Chem. C 119, 37 (2015) 21473-2182
- McKelvey, M. A. Edwards, P. R. Unwin, Anal. Chem. 82, 15 (2010) 6334-6337
- ic-SECM Tutorial “ic-SECM introduction”
- Application Note #6 “The advantages of using intermittent contact (ic) for SECM and ac-SECM measurements: two examples in corrosion.”
- Application Note #11 “Measurement of a nano-patterned gold sample by ic-ac-SECM”
- Gwyddion data analysis software gwyddion.net
- Technical Note #10 “The application of Gwyddion imaging software to M370/M470 results”
- Application Note #12 “3D Map production using the 3DIsoPlot software
- A. Lazenby, K. McKelvey, P. R. Unwin, Anal. Chem. 85, 5 (2013) 2937-2944
- O. Wipf, A. J. Bard, Anal. Chem., 64, 13 (1992) 1362-1367


