Electrochemical Noise Measurements Part I: ASTM assessment and validation of instrumental noise Corrosion – Application Note 39-1
Latest updated: January 31, 2024Abstract
Noise measurements consist of recording the voltage and current fluctuations occurring when two electrodes of the same material (or not) are shorted. These measurements can lead to the determination of corrosion parameters. The fluctuations are of very small amplitude and this is why the choice of the instrument used in this purpose is critical. Efforts have been made by the American Society for Testing and Materials (ASTM) to give a procedure to characterize the measurement ability of the instrument. This second procedure involves a real electrochemical system namely a steel sample in acidic medium. A comparison of the noise resistance obtained using BioLogic instruments and by the authors lead to conclude that Bio-Logic instruments are suitable for noise measurements.
Introduction
The aim of this application note is to show the ability of BioLogic equipment to perform reliable noise measurements that can be ultimately used to assess the corrosion characteristics of any corroding material. The procedures described below follow those given in the ASTM proceedings about noise measurement for corrosion applications [1]. Our results are compared with the requirements mentioned in the ASTM publication.
The Electrochemical Current Noise (ECN) is defined as spontaneous current fluctuations occurring between two dissimilar or identical electrodes held at the same potential. These current fluctuations are due to a galvanic activity between either two dissimilar electrodes or two electrodes of the same material with microstructural differences. ECN is usually measured using a Zero Resistance Ammeter (ZRA), which connects the two working electrodes. A reference electrode or a pseudoreference electrode of the same material as the working electrodes can be used to measure the potential fluctuations, which are called Electrochemical Potential Noise (EPN). The first measurement of EPN for corrosion studies was described by Iverson et al. [2] in 1968, followed 15 years later by Electrochemical Current Noise (ECN) measurements [3]. Noise measurements can be used to obtain information on the characteristics (noise resistance Rn) and the mechanisms (pitting, crevice, stress corrosion cracking, intergranular corrosion) of a corroding system [4].
ASTM Requirements
Two procedures are described in the ASTM publication to assess and validate the instrumentation:
Procedure 1 consists of measuring the EPN and ECN when no electrochemical cell is connected to the potentiostat. The potential measurement terminals (S1, S2, S3) are short-circuited to ground to record the EPN. The other leads (P1, P2) are left hanging. According to ASTM, “this should give a potential reading of 1 µV or less” [1]. For the measurement of ECN, the leads are left open (“dangling leads”) : P1, S1, S2 on one side and P2, S3 on the other side are connected together. In the bandwidth from 0 to 10 Hz, the current noise levels should be lower than 10 pA.
Procedure 2 consists of analyzing a sine wave source considered to be a known noise source. A 1 Vpp, 1 Hz sine wave is applied using the VSP-300’s second channel to feed the first channel with which the measurement is made. This is explained in more detail in the EC-lab Technical Note #25b. The test circuit that was used in the ASTM reference [1] is shown in Fig. 1.
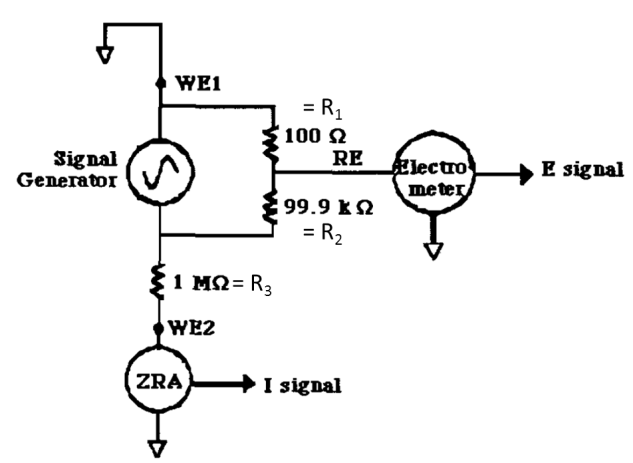
Figure 1: Test circuit used in procedure 2.
A voltage divider is used to produce an output voltage that is a fraction of the input voltage, without affecting the dynamics of the wave signal. The peak to peak amplitude (Epp) of the measured voltage (E signal) is obtained using the following formula:
$$E_{pp}=E_{inpp}\frac{R1}{\left(R1+R2\right)} \tag{1}$$
Where Einpp is the peak to peak voltage amplitude coming from the second channel of the VSP-300, R1 and R2 are the values of the resistances in the voltage divider. For R1 and R2 equal to 100 and 100 000 Ω, respectively, Epp = 1 mV. The peak to peak amplitude (Ipp) of the current response (I signal) is obtained using Ohm’s law:
$$I_{pp}=\frac{E_{inpp}}{R3} \tag{2}$$
where R3 is the value of the resistance in the current measurement part of the circuit. For R3 = 1 MΩ, Ipp = 1 µA. The ASTM requirement for this measurement is that the instrumental noise should be two decades less than Epp i.e. less than 0.01 mV.
Experimental Setup
Noise measurements are performed with EC-Lab® and EC-Lab® Express using the ZRA technique that can be found in the Corrosion application section. In this technique, the potentiostat maintains a potential difference of 0 V between the Counter Electrode (CE) and the Working Electrode (WE) and measures the resulting current flowing between the CE and the WE. The potential difference between the CE/WE system and the Reference electrode (Ref) is also measured.
In this application note, a VSP-300 was used. For the procedure 1, an Ultra Low Current (ULC) option was used. The current range is 1 pA. The ZRA technique is used to record the ECN and the OCV Fast technique is used to record the EPN. For the procedure #2, no ULC option was used and the current range was 1 µA. The CASP technique (Application Note #37) was used to generate the 1 Hz sine wave of 0.5 V amplitude (or 1 V peak to peak). The resulting potential was recorded using the ZRA technique. For both procedures, the smallest potential control range was used, allowing a control resolution of 1 µV. A low pass 1 kHz analog filter was applied on the measured current and potential. This analog filter can be chosen in the Advanced Settings tab. The sampling rate was 100 Hz (i.e. one point every 0.01 s). The duration of the measurement is 300 s, which means that the lowest frequency that can be observed is 1/(300) ≈ 3.3 mHz (see Appendix).
Results
Procedure 1: Figure 2 shows the amplitude spectrum of the EPN. Following the expression of the Discrete Fourier Transform function of a sine wave [5], the values given are actually ½ of the corresponding values in the time domain. In Fig. 2, it can be seen that the EPN is below 1 µV at any frequency higher than around 30 mHz [1].
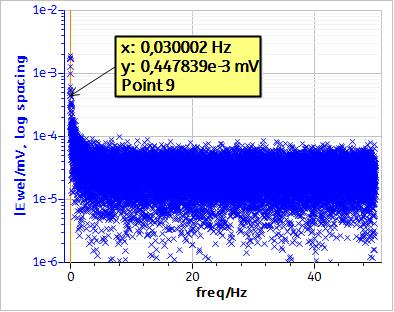
Figure 2: Amplitude spectrum of the EPN obtained following procedure 1.
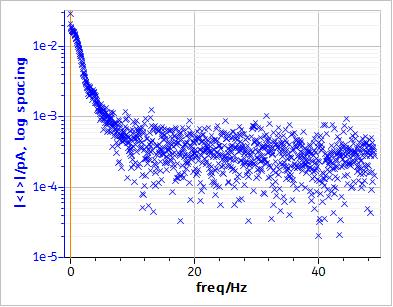
Figure 3: Amplitude spectrum of the ECN obtained following procedure 1.
The ECN obtained with the “dangling leads” is shown in Fig. 3. For every frequency up to 10 Hz, the current noise is below 0.1 pA, which is two decades below the threshold current of 10 pA recommended in the ASTM reference [1].
Procedure 2: Figures 4 and 5 show the voltage trace resulting from the procedure 2 and its amplitude spectrum, respectively. In Fig. 4, it can be seen that Epp is 0.68 + 0.34 ≈ 1 mV as was theoretically expected. The amplitude spectrum shows that almost all the potential noise of the instrument (i.e. all the signal except the 1 Hz applied “noise”) is lower than 5 µV, which corresponds to 10 µV in the time domain and is the value specified in the ASTM reference [1]. At 1 Hz, the value of the potential can be read. This potential is 250 µV, which is around 1/2 of the amplitude of the measured potential (Fig. 4).
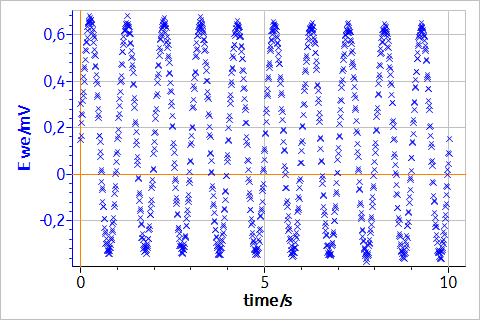
Figure 4: Voltage trace E resulting from the applied 1 Hz potential sine wave (Procedure 2).
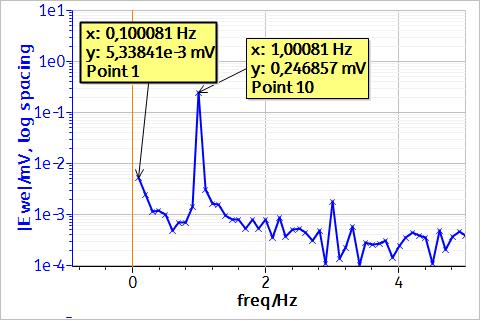
Figure 5: Amplitude spectrum of the Voltage trace E resulting from the applied 1 Hz potential sine wave (Procedure 2).
Conclusion
This note shows that the intrinsic potential and current noise of the VSP-300 with an Ultra Low Current option complies with and is even superior to the requirements of the ASTM publication for noise measurements. Therefore the VSP-300 and associated technology SP-200, SP-240, VMP-300 and SP-300 potentiostats are perfectly suited for carrying out reliable noise measurements on electrochemical systems. The second part of this note will show that BioLogic equipment can reliably perform noise measurements on a real electrochemical system in agreement with ASTM.
Data files can be found in :
C:\Users\xxx\Documents\EC-Lab\Data\Samples\Corrosion\AN_39_ZRA_I_XXX
Appendix
The highest measurable frequency that can be resolved in the frequency domain is given by :
$${f\frac{1}{2\Delta t}}_{max} \tag{3}$$
where Δt = the sampling interval.
This frequency is known as the Nyquist frequency, cutoff or folding frequency. This is, in fact, the high-frequency limit in the spectra obtained. Thus, for a sampling rate of once every second (1 Hz), the highest frequency that can be resolved in the frequency domain is 0.5 Hz.
The low-frequency resolution of the spectrum of a discrete time record is given by :
$${f\frac{1}{N\Delta t}}_{min} \tag{4}$$
where N = the number of samples and Δt = the sampling interval.
References
J. R. Kearns et al., ASTM STP 1277 (1996) 446.
W. P. Iverson, J. Electrochem. Soc. 115 (1968) 617.
J. L. Dawson, K. Hladky, D. A. Eden, Proc. of the Conf. UK Corrosion ’83, 99.
R. A. Cottis, Corrosion 57, 3 (2001) 265.
R. Bracewell, The Fourier Transform and Its Applications, McGraw-Hill, New York, 79 (1999) 100.
Revised in 08/2019