

Impedance, admittance, Nyquist, Bode, Black, (EIS plot) Battery – Application Note 8
Latest updated: November 28, 2023Abstract In impedance spectroscopy, either a voltage wave is applied and current is measured, or current is applied and the voltage is measured. Whichever way the data is obtained, it contains a current-voltage characteristic for a number of frequencies. Therefore each data point contains either a modulus and phase angle, or a real and imaginary part (these two options are 100 % equivalent) of impedance or admittance (and these two options are also 100 % equivalent), and a frequency. So whichever way it’s plotted, as long as it’s a 2D plot, it only shows a certain representation of the data, that is missing the third dimension, whether plotting impedance or admittance in Nyquist, Bode or Black representation.
Researchers from different fields have personal, but mostly historical preferences towards one representation or another. This Application Note explains how they are constructed and how they are all available to users of BioLogic potentiostats/galvanostats/ZRAs, and battery cyclers.
Impedance or Admittance Nyquist Diagrams
Impedance Z and admittance Y are two inverse transfer functions linked by the following very simple relation:
$$Z = \frac{1}{Y} \tag{1}$$
Let us consider the electrical circuit shown in Figure 1 corresponding to circuit #1 of the Test Box-3 [1]. 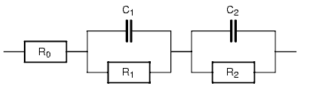 Figure 1: Voigt circuit made of three Rs and two Cs.
The experimental Nyquist diagram of the impedance Z is show in Figure 2 [1]. Since frequency values are lost in the Nyquist diagram, it is useful to indicate the frequency of some characteristic points (top of the semicircles).  Figure 2: Nyquist impedance diagram of the electrical circuit shown in Figure 1. Arrow always indicates increasing frequencies.
 Figure 2: Nyquist impedance diagram of the electrical circuit shown in Figure 1. Arrow always indicates increasing frequencies.
Obviously the high frequency semi-circle is smaller than the low frequency semi-circle. To highlight the high frequency part of the diagram, it is better to plot the admittance diagram instead of the impedance diagram as shown in Figure 3. The admittance diagram in Figure 3 gives a clearer high frequency semi-circle. Does the graph of the admittance contain more information than the graph of the impedance? No, the admittance diagram only presents information differently.
 Figure 3: Nyquist admittance diagram of the electrical circuit shown in Figure 1.
 Figure 3: Nyquist admittance diagram of the electrical circuit shown in Figure 1.
Impedance or Admittance Bode Diagrams
To be convinced of that, we can plot the impedance and admittance Bode diagrams as shown in Figure 4. Let us recall that plotting the Bode diagram of a transfer function H consists of plotting the decimal logarithm of the magnitude of H given by:
$$|H| = {\sqrt {(\mathrm{Re} H)^2+(\mathrm{Im} H)^2}} \tag{2}$$
and the phase of H given by:
$$\phi_H = \mathrm{arctan}\left(\frac{\mathrm{Im} H}{\mathrm{Re} H}\right) \tag{3}$$
vs. the decimal logarithm of frequency or radial frequency. According to Eq. (1), it is obvious that
$$\mathrm{log}|Y| = -\mathrm{log}|Z| \tag{4}$$
and
$$\varphi_Y = -\varphi_Z \tag{5}$$
The graphs showing magnitude and phases in Figure 4 are symmetrical with respect to the horizontal axis. There is no more information in an admittance diagram than in an impedance diagram.  Figure 4: Bode impedance and admittance diagrams of the electrical circuit shown in Figure 1.
 Figure 4: Bode impedance and admittance diagrams of the electrical circuit shown in Figure 1.
Impedance or Black Diagrams
Electricians use other representations, such as Black diagrams, for example, where the decimal logarithm of the magnitude is plotted versus the phase (Figure 5).  Figure 5: Black impedance and admittance diagrams of the electrical circuit shown in Figure 1.
 Figure 5: Black impedance and admittance diagrams of the electrical circuit shown in Figure 1.
As with the Nyquist diagram, frequency values are lost in Black diagram. Therefore, it is useful to indicate the frequency of some characteristic points.
Data files can be found in : C:\Users\xxx\Documents\ECLab\Data\Samples\Corrosion\Application Note 09\PEIS_circuit1
References
- Application Note #09 “Linear vs. non linear systems in impedance measurements”
Revised in 08/2019


