

Simultaneous impedance measurements elements of a running cell stack in EC-Lab® Express (EIS pack) Battery – Application Note 16
Latest updated: May 2, 2023Abstract
In this application note, the use of simultaneous EIS measurements on elements of a PEM fuel cell stack is demonstrated using a BioLogic VMP3. Impedance measurements on different cells within a stack under load can be useful, for example, to determine the internal resistance of each cell or if there is a problem with gas distribution within the stack. With special cables and several different booster options, the VMP3 or VSP can be configured to evaluate stacks of up to 20 elements of 100 cm2 surface area using a special galvanostatic electrochemical impedance spectroscopy (GEIS) technique.
Introduction
Electrochemical generators such as primary and secondary batteries, fuel cells (FCs), and supercapacitors are often composed of several elements connected in a series. It is possible to connect dozens of these elements on FC stacks. The measurement of the potential difference on each cell allows the user to detect if there is a dysfunction on a cell, but does not give the reason why. On the other hand, impedance measurements on the different cells under a constant load can be useful, for example, to determine the internal resistance value or if there is a problem with the gas distribution in the stack [1-6].
Theoretically, an impedance meter alone is enough to carry out the successive scans of each cell. However, given the number of elements to scan and the fact that one measurement on a single cell can last over ten minutes, the system could drift over time. This might explain why the impedance might be different from one cell to another. Also, the use of a multiplexer between the different cells and the impedancemeter could be a source of artifacts.
The VMP3/Z multi-channel potentiostat and EC-Lab® enable the user to make these measurements simultaneously. This reduces the experiment time significantly.
Technical Specificity of the Stack Applications
Materials and Connection
This application requires a special set of cables to connect each channel to the elements of the stack. This set is provided upon request. The master channel is connected to the whole stack to control the current, measure the voltage, and apply the AC stimulation. The slave channels are synchronized with the master one and measure the elements’ potential. The master channel can be coupled with a current booster 20 A/20 V to test the fuel cell stack and apply an AC signal of 10 A amplitude. Electronic loads are available too, and can be connected to the master channel. These loads can receive up to 150 A and 20 V.
So, this configuration can easily be used on stacks of 20 elements with 100 cm² surface area.
Software
EC-Lab® Express software offers the user several specific techniques for fuel cell stack testing in both galvanostatic and potentiostatic modes.
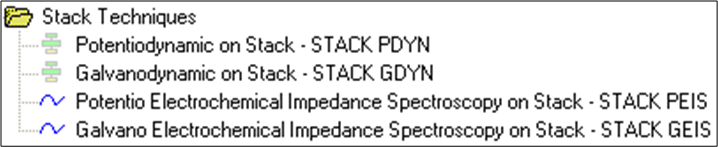
Figure 1: Available stack techniques in EC-Lab® Express software.
The GEIS stack technique (or another one) must be loaded on the master channel. When clicking on the Run button, the user will select the slave channel on which the EIS measurement will be carried out.
Impedance Measurement of an Electrochemical Generator
Two different protocols can be used to measure the impedance of the cells of a battery or a stack. These can be carried out with either the galvanostatic impedance protocol (Fig. 2) or a natural running protocol (Fig. 3). In the first case, the potentiostat delivers the discharge (or charge) current and the sine modulation of current. The impedance can then be directly measured on each cell. In the second case, the potentiostat only delivers the sine modulation. The impedance can only be measured on each cell if the charge impedance is high enough compared to the rest of the stack or if the value of the charge impedance is constant and has been already determined with an independent measurement.
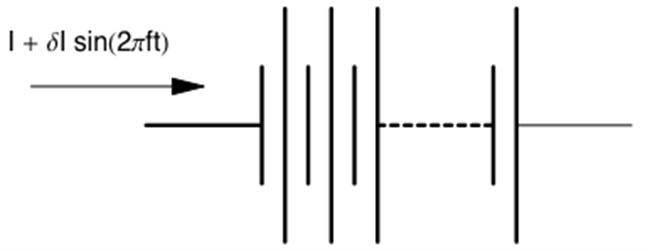
Figure 2: Galvanostatic impedance measurement on a cell stack.
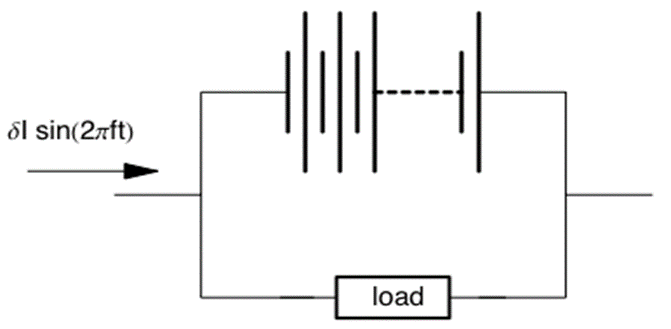
Figure 3: Impedance measurement on a cell stack using a natural running protocol.
Measurements on Four Batteries in Series
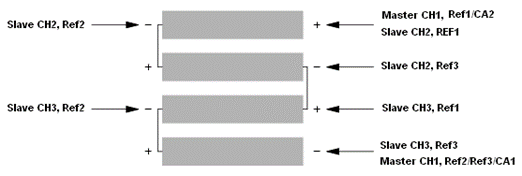
Figure 4: Simultaneous impedance measurements on a 4-battery stack using only 3 channels of the VMP3/Z.
These techniques have been tested on four alkaline batteries (R6 type) connected in series. Only three channels of the VMP3/Z are needed to measure the impedance of the four batteries separately. The required connections for the cell cables with the four batteries in series are described on Fig. 4. These connections work with both protocols presented in Fig. 2 and Fig. 3. The parameters are loaded first on the master channel. This channel will control the current and measure the potential of the whole stack. The two other channels will measure the 4 elements potential as slave channels synchronized with the master.
In A Relaxation Regime (I=0)
The Nyquist representation of impedance diagrams measured simultaneously on four cells (relaxation regime) is presented on Fig. 5 (Galvanostatic impedance, I = 0).
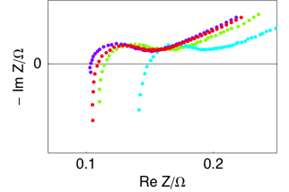
Figure 5: Cell stack of four alkaline batteries (type R6). Impedance diagrams of simultaneous measurements on the four alkaline batteries. Galvanostatic mode (Fig. 1). I = 0, δI = 20 mA, fmin = 0.1 Hz, fmax = 50 kHz.
In A Charge Regime
The Nyquist representation of impedance diagrams measured simultaneously on four cells in charge regime is presented on Fig. 6 (Galvanostatic impedance, I ≠ 0).
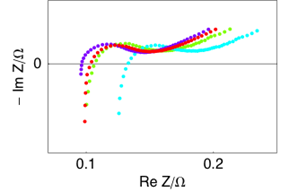
Figure 6: Cell stack of four alkaline batteries (type R6). Impedance diagrams of simultaneous measurements on the four alkaline batteries. Galvanostatic mode (Fig. 1). I = 0.1 A, δI = 20 mA, fmin = 0.1 Hz, fmax = 50 kHz.
In Discharge Regime
The Nyquist representations of pseudo-impedance diagrams measured simultaneously on four cells running on a 100 Ω resistor are presented on Fig. 7 (Galvanostatic impedance, I = 0).
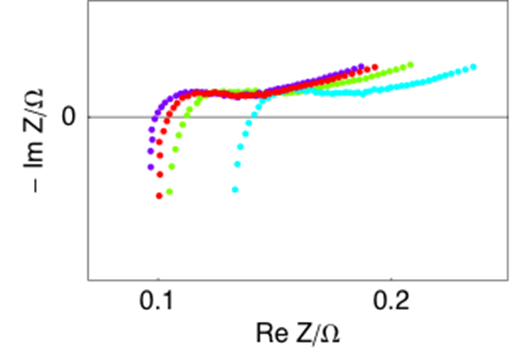
Figure 7: Cell stack of four alkaline batteries (type R6). Impedance diagrams of simultaneous measurements on the four alkaline batteries running under a 100 Ω charge. Natural running mode (Fig. 2). δI = 20 mA, fmin = 0.1 Hz, fmax = 50 kHz.
Running A Geis Experiment on Each Element of A PEMFC Stack with EC-Lab® Express
The PEMFC stack used in this experiment is made with 16 elements of 25 cm² each. The “GEIS on stack” technique performs an impedance experiment in the galvanostatic mode on different channels simultaneously. The current is controlled and the sine modulation is imposed through the entire stack by the first channel called the “master” channel. The connection is described in Fig. 4. The experiment was run on 13 elements of the stack; three of the potential measurement points were used by temperature probes.
To run an experiment with this technique, click on the “+” button in the experiment frame of EC-Lab® Express window and select “Stack GEIS”. The software’s main window is shown in Fig. 8.
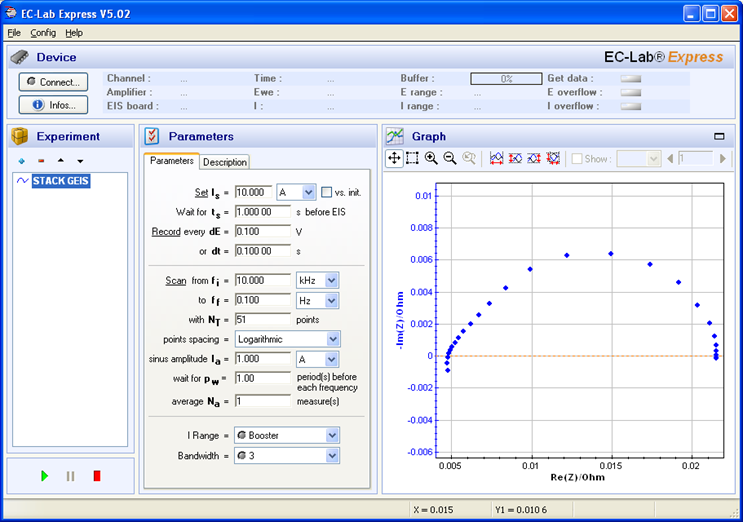
Figure 8: Main window of ZStack protocol.
It is made of three parts:
- on the left: the experiment frame to add techniques to the experiment
- in the middle: the parameter setting frame
- on the right: the graphic display with the curve and the graphic tools.
The way to perform the experiment is as follows:
- Select the master channel in the device frame.
- Load the stack GEIS technique
- Choose the parameters
- Click on the “Run” button
- Select the slave channels
- Define a file name to store data
The data are displayed on separate graphs. The result of the stack GEIS experiment can be seen on figure 9 below.
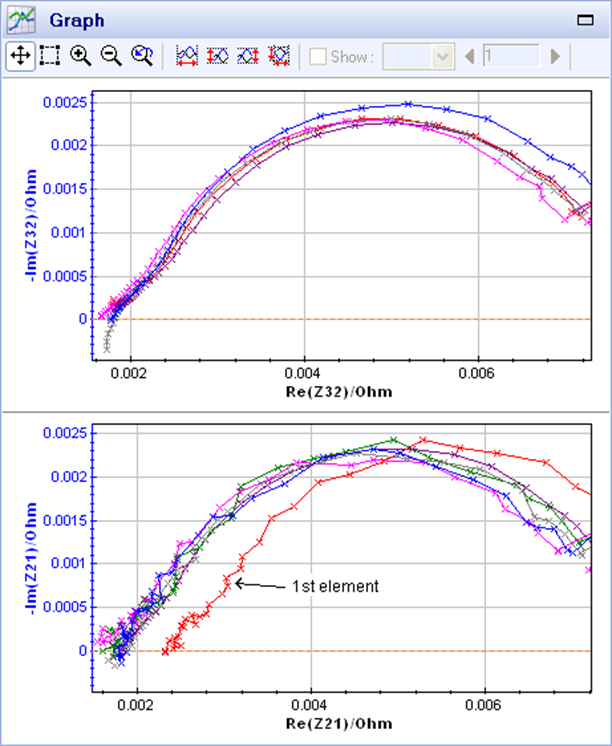
Figure 9: Simultaneous GEIS measurement on a PEM fuel cell Stack at 50°C, 10 A.
The general shape of the EIS curves presents the classical main arc for fuel cells with a frequency on the top of the arc at 10 Hz.
All the curves present a similar shape with similar impedance. On the bottom graph, the red curve corresponding to the first element is shifted to the right. This is probably due to the different connections on the extremity of the stack resulting in a higher contact resistance.
Conclusion
The simultaneous EIS measurements on 13 elements of a PEM fuel cell stack have been demonstrated. EIS data can be fitted with electrical equivalent circuits in EC-Lab® software using ZFit.
References
- J.-P. Diard, N. Glandut, B. Le Gorrec, and C. Montella, J. Electrochem. Soc, 151 (12) (2004) A2193.
- W. H. Zhu, R. U. Payne and B. J. Tatarchuk, J. Power Sources, 168 (1) (2007) 211.
- M. Han, X. Tang, H. Yin and S. Peng, J. Power Sources, 165 (2) (2007) 757.
- X. Yuan, J. Colin Sun, M. Blanco, H. Wang, J. Zhang and D. P. Wilkinson, Journal of Power Sources, 161 (2) (2006) 920.
- W. Merida, D.A. Harrington, J.-M. Le Canut and G. McLean, J. Power Sources, 161 (1) (2006) 264.
- J.-M. Le Canut, R. Abouatallah and D. A. Harrington, J. Electrochem. Soc., 153 (2006) A857.
Revised in 08/2019


