

Achieving micron scale measurements using the SECM150 Scanning Probes – Application Note 18
Latest updated: June 17, 2024Abstract
The SECM150 has been designed with high resolution Scanning Electrochemical Microscopy (SECM) measurements in mind. This note demonstrates the use of the 1 µm probes with the SECM150 to measure 1 µm features. Pointers for successfully measuring features on the micron scale are given.
Introduction
The SECM150 has been designed with high resolution in mind. The SECM150 has a small possible step size (down to 50 nm), which matches well with the capillary SECM probes offered by BioLogic (Product code U-P5/05, 02, & 01). Furthermore, the design of the SECM150 allows these small probes to be used with scan rates which achieve results quickly, without excessive loss in quality of the scan. The high resolution of the SECM150 makes it ideal for investigating features on the micron scale.
In this application note the SECM150 is used to measure membranes with pore sizes down to 1 µm, over a standard Au sample. Using the SECM150 it was possible to focus on areas under 10 x 10 µm2, and easily resolve 1 µm features.
Method
The SECM150 was used to perform Generator-Collector dc-SECM measurements on Whatman® polycarbonate porous membranes over a standard Au sample. Two different types were used: CycloporeTM track etched membranes with 12 µm pores (PC12), and NucleoporeTM track etched membranes with 1 µm pores (PC1). Membranes were adhered to the resin of the Au sample using clear nail polish, so the shiny side was facing up. To allow removal of pockets of air between the membrane and Au a small slit was made in the membranes close to the Au-resin border. The membrane could then be rubbed with a plastic pipette to remove any air pockets formed once submerged in electrolyte.
The PC12 membrane was measured in 5 x 10⁻³ mol L-1 K3[Fe(CN6)] in 0.1 mol L-1 KCl. Measurements were performed using a 1 µm Pt probe biased at 0.65 V vs SCE. The Au was biased at -0.25 V vs SCE. A Pt sheet was used as the counter electrode. Approach curves were performed to determine the probe z position for the measurement. The following settings were used:
PC12:
- µm / Point: 0.35
- Step Velocity: 1 µm / s
- Acquisition pre-delay: 0.5 s
- Number of Samples: 100
- Sample Rate: 1000 Hz
- Revised Step Size: None
The area scan of the PC12 membrane consisted of 201 x 201 points over an area of 100 x 100 µm2.
The PC1 membrane was measured in 5 x 10⁻³ mol L-1 K3[Fe(CN6)] in 0.1 mol L-1 KCl. A 0.5 µm Pt probe was used to perform all measurements. The probe and Au were biased at -0.25 and 0.65 V vs SCE respectively. The counter electrode was a Pt sheet. Prior to performing area scan measurements approach curves were performed to determine the probe z position. The following settings were used:
PC1:
- µm / Point: 0.25
- Step Velocity: 0.5 µm / s
- Acquisition pre-delay: 0.1 s
- Number of Samples: 100
- Sample Rate: 1000 Hz
- Revised Step Size: 0.1 µm
For the PC1 membrane a series of measurements was performed focusing on smaller areas with each subsequent measurement. These were 25 x 25, 10 x 10, 5 x 5, and 3 x 3 µm2 areas. The first three scan sizes were composed of 101 x 101 points, while the 3 x 3 µm2 scan was a 61 x 61 point map.
![SECM area scan of PC12 membrane over a Au sample. Measurements were performed in 5 x 10⁻³ mol L-1 K3[Fe(CN6)] in 0.1 mol L-1 KCl with the 1 µm Pt probe biased at 0.65 V, and the Au biased at -0.25 V.](data:image/svg+xml;base64,PHN2ZyB4bWxucz0iaHR0cDovL3d3dy53My5vcmcvMjAwMC9zdmciIHdpZHRoPSIzODUiIGhlaWdodD0iMzI1IiB2aWV3Qm94PSIwIDAgMzg1IDMyNSI+PHJlY3Qgd2lkdGg9IjEwMCUiIGhlaWdodD0iMTAwJSIgc3R5bGU9ImZpbGw6I2NmZDRkYjtmaWxsLW9wYWNpdHk6IDAuMTsiLz48L3N2Zz4=)
Figure 1: SECM area scan of PC12 membrane over a Au sample. Measurements were performed in 5 x 10⁻³ mol L-1 K3[Fe(CN6)] in 0.1 mol L-1 KCl with the 1 µm Pt probe biased at 0.65 V, and the Au biased at -0.25 V.
![SECM area scan of PC12 membrane over a Au sample. Measurements were performed in 5 x 10⁻³ mol L-1 K3[Fe(CN6)] in 0.1 mol L-1 KCl with the 1 µm Pt probe biased at 0.65 V, and the Au biased at -0.25 V.](https://biologic.net/wp-content/uploads/2019/08/scanan18f1.png)

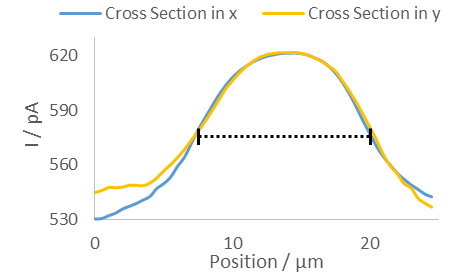
Figure 2: Cross sections of a PC12 pore in the x (blue) and y (gold) directions. The black dashed line shows the FWHM of 12.5 µm for both the x and y directions.
Results
When SECM is used to measure the PC12 membrane over Au a number of well-defined, higher current dots are seen, Fig 1. Contrast is seen due to a difference between the insulating polycarbonate and the underlying Au. When the UME is over one of the membrane pores the underlying Au produces the redox molecule of interest, in this case [Fe(CN)6]4-, which is measured by the UME. A cross section of one of the dots was measured in x and y, showing a Full Width at Half Maximum (FWHM) of approximately 12 µm, Fig 2, as expected based on the marketed pore size.

Figure 3: SECM approach curve to PC1 membrane over Au sample with a 0.5 µm probe.
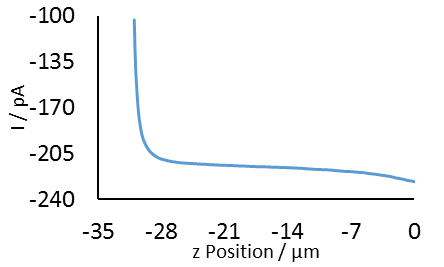
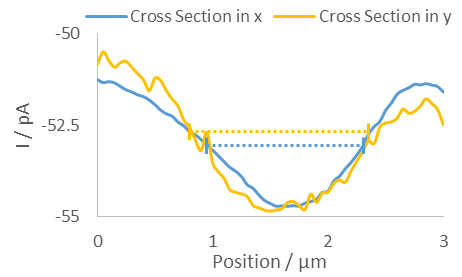
Fig 3 shows an example approach curve to PC1. The final z position measured was used to set the probe position of the subsequent area scans. A series of four area scans were performed on the PC1 on Au sample, as shown in Fig 4. The dashed lines show the area of focus for the next scan in the sequence. For all but the 3 x 3 µm2 scan the step size was reduced to increase resolution. As with the PC12 on Au sample, the well-defined dots arise from the exposure of the underlying Au to the electrolyte. In this case biasing the Au produces more [Fe(CN)6]3-, increasing the signal. Again the FWHM is as expected for the marketed pore size, Fig 5.
Tips For Success
Use a Faraday Cage
While stray electrical noise can affect any SECM measurement this is particularly the case when working with electrodes on the micron scale. In this case the resulting low currents measured by probes of ≤ 5 µm means any stray electrical noise has a proportionally larger effect than on the larger electrodes. Although all care has been taken to provide users with bandwidth options which adequately remove stray electrical noise, a small probe diameter, and/or low redox mediator concentration can mean extra precautions are required. To avoid noisy results, therefore, it is advised that measurements performed with the smaller capillary probes are performed within a Faraday cage.
![SECM measurements of PC1 membrane over Au sample measured in 5 x 10⁻³ mol L-1 K3[Fe(CN6)] in 0.1 mol L-1 KCl. The 0.5 µm Pt probe was biased at -0.65 V and the Au at 0.25 V. Measurement areas were (a) 25 x 25 µm2, (b) 10 x 10 µm2, (c) 5 x 5 µm2, and (d) 3 x 3 µm2. Scans were performed in the order (a), (b), (c), (d). The dashed purple box in scans (a) – (c) indicates the area of the next scan.](data:image/svg+xml;base64,PHN2ZyB4bWxucz0iaHR0cDovL3d3dy53My5vcmcvMjAwMC9zdmciIHdpZHRoPSI3MzYiIGhlaWdodD0iNTgyIiB2aWV3Qm94PSIwIDAgNzM2IDU4MiI+PHJlY3Qgd2lkdGg9IjEwMCUiIGhlaWdodD0iMTAwJSIgc3R5bGU9ImZpbGw6I2NmZDRkYjtmaWxsLW9wYWNpdHk6IDAuMTsiLz48L3N2Zz4=)
Figure 4: SECM measurements of PC1 membrane over Au sample measured in 5 x 10⁻³ mol L-1 K3[Fe(CN6)] in 0.1 mol L-1 KCl. The 0.5 µm Pt probe was biased at -0.65 V and the Au at 0.25 V. Measurement areas were (a) 25 x 25 µm2, (b) 10 x 10 µm2, (c) 5 x 5 µm2, and (d) 3 x 3 µm2. Scans were performed in the order (a), (b), (c), (d). The dashed purple box in scans (a) – (c) indicates the area of the next scan.
![SECM measurements of PC1 membrane over Au sample measured in 5 x 10⁻³ mol L-1 K3[Fe(CN6)] in 0.1 mol L-1 KCl. The 0.5 µm Pt probe was biased at -0.65 V and the Au at 0.25 V. Measurement areas were (a) 25 x 25 µm2, (b) 10 x 10 µm2, (c) 5 x 5 µm2, and (d) 3 x 3 µm2. Scans were performed in the order (a), (b), (c), (d). The dashed purple box in scans (a) – (c) indicates the area of the next scan.](https://biologic.net/wp-content/uploads/2019/08/scanan18f4.png)

Figure 5: Cross sections of PC1 membrane over Au in the x (blue) and y (gold) directions. The blue dashed line corresponds to the FWHM of 1.3 µm in the x direction. The yellow dashed line corresponds to the 1.5 µm FWHM in the y direction.
Select an Appropriate Scan Rate
Some users may only be interested in achieving an area scan as quickly as the instrument will allow, while others may be willing to sacrifice speed to achieve the best possible measurement. Regardless users can take advantage of the wide range of scan rates available to them with the SECM150 to suit their needs. This may require some trial and error by the user to find what best meets the requirements for their experiment. Table 1 compares the use of fast and slow scan rates.
Table 1: The advantages of using fast and slow scan rates are outlined.
| Fast Scan Rates | Slow Scan Rates |
|---|---|
| Quickly screen a large area before focussing on smaller ones | Effect of electrical noise is reduced |
| Complete measurements before probe and/or sample fouling | Reduce the effects of stirring |
| Investigate dynamic changes in an area over time | Probe has time to equilibrate at each point |
Level the Sample
In any SECM measurement it is crucial the sample is level to achieve the best results. The small diameter of the probes used in these measurements makes this even more critical. Typically for a response to be measured by a probe the tip-sample distance must be less than or equal to three to five times the probe diameter [1]. While this is up to 125 µm for a 25 µm probe, this is only 5 µm or less for a 1 µm probe. Furthermore, for the best results it is typical to perform measurements at distances even less than this, i.e. within one tip diameter [2]. All of this implies that a sample tilt which had no effect on a 25 µm probe, could result in a poor, or even immeasurable response for a 1 µm probe. This effect is demonstrated in the approach curve to the PC1 membrane by the 0.5 µm probe, in Fig 3. In this approach curve it can be seen that changes in the probe current only occur over only ~2.5 µm. It is essential, therefore, that when using the probes of ≤ 5 µm the sample is level. To achieve this initially the sample should be levelled using the spirit level and the three thumb screws, before any experiments are performed. Once fully setup it is possible to further assess the sample tilt by performing an approach curve to each of the four corners of the measurement area. If there is a difference of more than three times the probe diameter for any of these the probe should be retracted far from the sample surface and the sample relevelled. This should be repeated until the tilt has been satisfactorily removed.
Warning: The user should be aware that changing the sample’s level will cause a height change. Before changing the levelling of the sample should only be done after the probe has been moved far from the surface, and/or from the probe clamp completely.
Select an Appropriate Redox Mediator
While the redox mediator is important in all SECM measurements, when working with probes on the micron scale this can be essential. Due to the low current nature of measurements performed using micron sized electrodes, electrode fouling can become more obvious, and a significant factor in selection of the redox mediator. In these measurements only K3[Fe(CN6)] is used, rather than an equal mixture with K4[Fe(CN6)], because this leads to noticeably less electrode fouling. This reduction in fouling in turn allows more and/or longer area scans to be performed before a noticeable reduction in the measured current occurs. A further consideration when deciding on the redox mediator is its diffusion coefficient, D. The diffusion coefficient is directly related to the current measured by the probe, therefore mediators with a low diffusion coefficient will further reduce the possible current measured. Testing of other standard and/or literature redox mediators by the user may allow for further improvement in their results. A table of selected mediators may be found in Chapter 1 of Scanning Electrochemical Microscopy [3].
Clean the Probe
Unlike the large capillary probes of ≥ 10 µm, the probes of ≤ 5 µm should not be mechanically polished. If these smaller probes are mechanically polished there is a high risk that the tip will break. Furthermore the smaller probes are made of pulled Pt wire, which tapers throughout the tip, therefore mechanical polishing will result in a change in the probe diameter and RG value. It is, however, possible to clean the probe electrochemically in situ. For the experiments carried out in this note it was possible to clean the probe by quickly alternating it’s bias between -1.5 and 1.25 V vs SCE using the multipotentiostat dialogue bar. This was repeated a few times and the bias returned to -1.5 V, before the cell was turned off and the probe allowed to return to OCP. The success of this biasing was judged based on the resulting CV. The CV of the 0.5 µm probe in used in the PC1 measurement, in 5 x 10⁻³ mol L-1 K3[Fe(CN6)] in 0.1 mol L-1 KCl is shown in Fig 6. Note the presence of dissolved oxygen in the electrolyte gives rise to the tilted baseline of the CV towards -0.25 V, and the apparent lack of a diffusion plateau. While the exact values will differ based on the size of the probe used, and the exact concentration of the redox probe, after cleaning the general shape should match that shown here.
![Cyclic voltammogram of 0.5 µm Pt probe in 5 x 10⁻³ mol L-1 K3[Fe(CN6)] in 0.1 mol L-1 KCl.](data:image/svg+xml;base64,PHN2ZyB4bWxucz0iaHR0cDovL3d3dy53My5vcmcvMjAwMC9zdmciIHdpZHRoPSIzMDAiIGhlaWdodD0iMTgxIiB2aWV3Qm94PSIwIDAgMzAwIDE4MSI+PHJlY3Qgd2lkdGg9IjEwMCUiIGhlaWdodD0iMTAwJSIgc3R5bGU9ImZpbGw6I2NmZDRkYjtmaWxsLW9wYWNpdHk6IDAuMTsiLz48L3N2Zz4=)
Figure 6: Cyclic voltammogram of 0.5 µm Pt probe in 5 x 10⁻³ mol L-1 K3[Fe(CN6)] in 0.1 mol L-1 KCl.
![Cyclic voltammogram of 0.5 µm Pt probe in 5 x 10⁻³ mol L-1 K3[Fe(CN6)] in 0.1 mol L-1 KCl.](https://biologic.net/wp-content/uploads/2019/08/scanan18f6.png)
Conclusion
The SECM150 in combination with micron size probes allows a user to make measurements of micron scale features. This has been demonstrated using two different track etched polycarbonate membranes. It has been shown that by first measuring a larger area individual features can be focused on and the resolution improved. Finally tips for successfully achieving measurements on the micron scale have been presented.
References
- Stoica, S. Neugebauer, W. Schuhmann, Adv. Biochem. Engin./ Biotechnol. 109 (2008) 455-492
- A. Alupche-Aviles, D. O. Wipf, Anal. Chem. 73 (2001) 4873-4881
- J. Bard, in : A. J. Bard, M. V. Mirkin (Eds.), Scanning Electrochemical Microscopy: Second Edition, CRC Press, Boca Raton (2012) 8.


