

ac-SECM to investigate battery electrode materials in non-aqueous electrolyte Scanning Probes – Application Note 7
Latest updated: June 13, 2024Abstract
Unlike dc-SECM, ac-SECM does not require the use of a redox mediator or the addition of an electrolyte salt as what is studied is the impedance of the probe. This makes ac-SECM particularly useful for corrosion applications, where the redox mediator can interact with the substrate and for battery applications, where organic electrolytes of low conductivity are commonly used.
Introduction
Energy storage is a growing field of interest for SECM applications. This note demonstrates one particular example of the use of SECM in this field. ac-SECM has been used to investigate the electrochemical activity and topography of a battery electrode provided by Sion Power. This measurement was performed in tetrabutylammonium perchlorate (TBA-ClO4) in propylene carbonate (PC).
ac-SECM
Unlike dc-SECM, ac-SECM does not require the use of a redox mediator or the addition of an electrolyte salt. It is possible to perform an ac-SECM measurement in tap water, something which is impossible for dc-SECM. As neither a redox mediator nor a salt is needed, ac-SECM can be used with systems typically difficult to measure by SECM because of adverse interactions with the redox mediator and/or electrolyte.
Furthermore the use of ac-SECM means it is not necessary to work at the diffusion limited regime of the probe. Although ac-SECM requires careful control of the parameters it allows the surface electrochemistry to be probed while the integrity of the sample is maintained.
When investigating novel and complex systems, therefore, ac-SECM is a useful initial measurement step as removing the need for a redox mediator reduces the number of variables involved in the measurement.
In ac-SECM the impedance response is controlled by more than just the surface type. While approach to an insulator always results in an increase in impedance with decreasing tip-sample distance, the response on approach to a conductor can vary.
If a low conductivity electrolyte, or a high frequency is used smaller tip-sample
distances result in a reduction in impedance. If, however, a high conductivity electrolyte or a low frequency are used then decreasing the tip-sample distance increases the impedance. This means that in ac-SECM the response can be altered through careful control of the measurement frequency, without having to alter the experimental setup.
A typical ac-SECM measurement results in maps of both the ac current and complimentary impedance magnitude of the surface.
More information on this subject can be found at the ac-SECM tutorial on the Bio-Logic website.1
Method
The Sion Power battery electrode was fixed onto a PTFE blank using bees wax. An electrical connection was not made to this sample. This was then mounted in the µTriCellTM, which was filled with 0.1 M TBA-ClO4 in PC. A 10 µm Pt probe was used.
The counter electrode was a Pt sheet, while the reference electrode was a screen printed Ag/AgCl electrode. A 0.1 V vs. Ag/AgCl dc bias, a 25 mV ac bias, and a 100 kHz bias frequency were applied between the probe and the counter electrode.
The Sion Power electrode was measured over an area of 500 µm x 500 µm, with a step size of 5 µm. This measurement took 10 hours and 33 minutes to complete.
Results
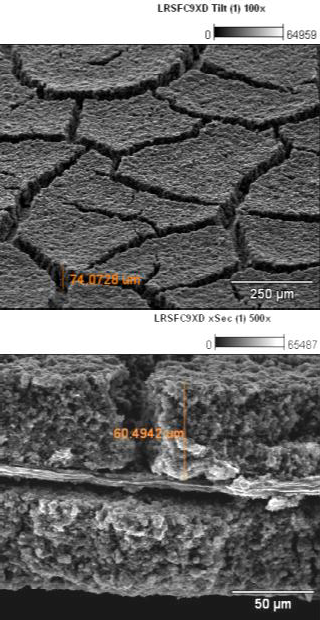
Figure 1 shows an SEM measurement of the Sion Power electrode. It is obvious from this image that the electrode surface is composed of flakes separated by distinct troughs.
These troughs are on the order of tens of microns and therefore should be clearly seen in any SECM measurements.

Figure 1: SEM image of Sion Power electrode. (a) is a top view of the electrode and (b) the side on view. The troughs between different flakes are readily apparent.
Prior to performing any SECM measurements the tip was characterized using a frequency sweep experiment, as shown in Figure 2. This was performed at a dc bias of 100 mV vs. OCP and an ac bias of 25 mV was applied between the probe and counter electrode.

Figure 2: Impedance magnitude vs. frequency plot measured for the Pt probe in 0.1 M TBA-ClO4 in PC, at a dc bias of 0.1 V vs. OCP and an ac bias of 25 mV.


Figure 3: A typical result for the approach of the Pt probe to the electrode surface is shown. As the distance between the tip and sample decreases the impedance magnitude decreases (a), while the current increases (b), indicative of an electrically conductive surface.

Furthermore, by performing this measurement it is possible to determine the expected impedance magnitude at a given frequency for comparison to the subsequent approach curves and area scans.
ac-SECM was used in this investigation to keep the experimental setup as simple as possible, removing any difficulties which may arise as a result of the interaction of the redox mediator and sample.
As already described, when using ac-SECM the electrolyte conductivity and applied ac frequency are important. 0.1 M TBA-ClO4 in PC is a relatively low conductance electrolyte (2.8 mΩ-1•cm-1 2 vs. 12.8 mΩ-1•cm-1 for aqueous 0.1 M KCl3) as such it is expected that on approach to both an insulator and a conductor impedance will increase.
It is possible, however, to differentiate between the two, by applying a high ac frequency to the probe. To determine the appropriate frequency the applied frequency was increased by one order of magnitude at a time, until a decrease in impedance on approach to a conductor was seen. In the experiment shown the application of a bias of 100 kHz to the probe was large enough to current and impedance magnitude maps are seen in Figure 4. Large areas of low ac current (high impedance) bordered by smaller areas of increased ac current (decreased cause this decrease. When approach to the electrode was performed a decrease in impedance magnitude was seen, as shown in Figure 3. This indicates the sample is electronically conductive.

Figure 4: (a) ac-current magnitude of Sion sample measured in 0.1 M TBA-ClO4. (b) Complimentary impedance magnitude map.
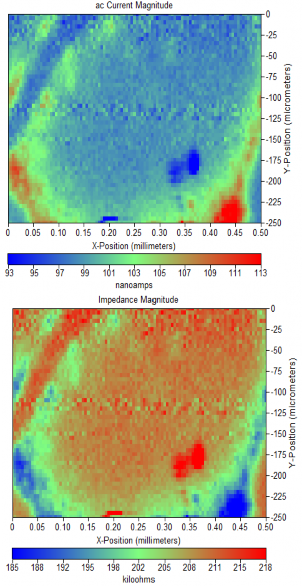
Using the final z-position obtained from a series of approach curves it was possible to position the SECM tip above the Sion Power electrode surface to allow imaging of the ac electrochemical activity. The resulting ac-impedance) can be seen. These regions clearly resemble the flake and trough features of the SEM image shown, proving that ac-SECM is capable of resolving the features of the system.
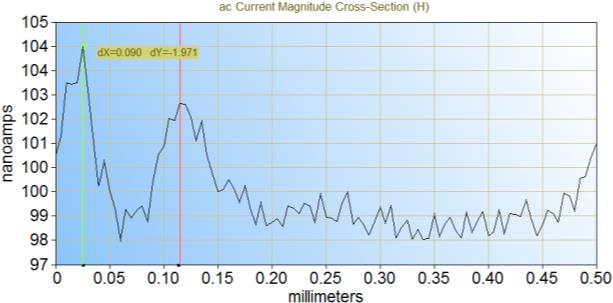
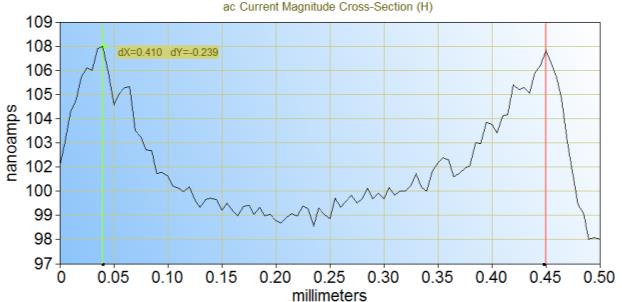
It is possible to measure both the trough and flake size by looking at the cross-section of the measurements, as shown in Figure 5. From these particular cross sections it can be seen that the trough is 90 µm and the flake 410 µm. This matches well with the dimensions determined from the SEM images.


Figure 5: Cross-sections of the ac-SECM area scan can be taken to determine the size of the troughs (a) and flakes (b) of the electrode. (a) corresponds to y = -65 μm and (b) to y = -215 μm in Figure 4a.
The SEM images can be used to help deconvolute the sample topography from the electrochemical activity. An increase in ac- current is seen at the edges of the troughs. Based on the SEM image (Figure 1b) a rise in topography is unlikely the cause for this increase in current as the sample should be almost completely flat, aside from the sharp drop in height for the trough.
This means the increase in current is probably due to an increase in electrochemical activity at the trough edge.
This is probably due to an edge effect in which the increase from one to two exposed surfaces causes an increase in local activity.
The approach curves act to further support the idea that the measured ac-current is a result of electrochemical activity and not topography alone.
Based on the SEM images the troughs have a depth of ~60 μm. From the approach curves the troughs should therefore correlate to a reduction in current of ~16 nA, or an increase in impedance magnitude of ~320 kΩ, around an order of magnitude higher than is seen in either case.
This discrepancy between the expected and experimental results indicates the measured current and impedance are a result of a change in activity at the trough.
Conclusion
Through the use of ac-SECM, a Sion Power electrode has been imaged in a non-aqueous electrolyte. By carefully selecting the ac-frequency a clear response from the surface can be measured.
This electrode shows visually apparent troughs in an otherwise level surface. These troughs are strikingly apparent in both the impedance and ac-current maps collected from the sample.
Comparison of the SECM results with SEM measurements indicate that there is an edge effect at the boundaries of the trough, and a change in electrochemical activity at the trough.
Through this experiment one of the many potential applications of SECM to the measurement of battery relevant systems has been highlighted.
References
- ac-SECM Tutorial
- G. Moumouzias, G. Ritzoulis, Journal of Solution Chemistry 1996, 25, 1271-1280
- Y. C. Wu, W. F. Koch, K. W. Pratt, Journal of Research of the National Institute of Standards and Technology 1991, 96, 191-201
revised 12/2014


