

How to perform Dynamic EIS during Battery Cycling
Latest updated: January 13, 2026Traditional static Electrochemical Impedance Spectroscopy (EIS) testing requires satisfying three prerequisites: linearity, time-invariance and stationarity. It means EIS testing can only start after the lithium-ion battery has equilibrated. This approach is constrained by its reliance on steady-state conditions, which may not be representative of actual battery operating conditions (charge transfer dynamics, transient diffusion processes, growth process of lithium dendrites, lithium plating detection, etc.). Dynamic EIS, which is performed with a DC bias component in addition to the excitation signal, can reflect the behavior of a battery in real-time, capturing processes or electrochemical reactions that may gradually weaken or even disappear during rest periods. [1]
Static vs. Dynamic EIS: Finding the sweet spot
While static EIS provides mathematically rigorous impedance data, it cannot capture the battery’s behavior under actual operating conditions. Dynamic EIS, by contrast, sacrifices some theoretical rigor to obtain data that reflects real-world battery performance.
It is crucial to recognize that Dynamic EIS measurements may not strictly satisfy the stationarity criterion – a fundamental requirement for classical EIS theory. During charging or discharging, the battery’s state continuously evolves, meaning the system is inherently non-stationary and time-variant. This can introduce artifacts and uncertainties in the impedance spectra that would not appear in properly conducted static measurements.
Therefore, researchers must exercise careful judgment when interpreting Dynamic EIS data. The results should be viewed as approximations that provide valuable operational insights rather than as rigorous fundamental impedance measurements. It is essential to verify the validity of the EIS data through appropriate validation criteria before proceeding with interpretation. Proper validation against static EIS data at key states of charge, along with careful experimental design to minimize non-stationary effects, is necessary for obtaining quality data.
Check here how to check and correct the time variance of your system under EIS measurements.
Best practices and considerations
Obtaining high-quality EIS data requires adherence to best practices such as maintaining stable temperature throughout measurements and minimizing cable length to reduce artifacts. Consider the following additional points to design safe and optimized protocols.
Safety limits: protect both the cell and the equipment – Always set upper and lower voltage limits or temperature cutoffs appropriate for your cell chemistry. In EC-Lab®, apply safety limits in “Safety/Adv.Settings” tab.
Amplitude Selection for EIS & Data Quality: the AC amplitude is one of the most critical parameters. Use your existing cell data to guide this choice or consider using adaptive amplitude (GEIS AA) to facilitate amplitude selection. Check linearity and stationarity to assess the data validity and optimize the settings. In EC-Lab®, you can check linearity with THD and stationarity with NSD, tick EIS QI™ in Safety/Adv.Settings. More information here.
Current application: in EC-Lab®, you can use C-rate instead of current in the protocol by specifying battery capacity in “Cell Characteristics” or by determining battery capacity with the HPC technique.
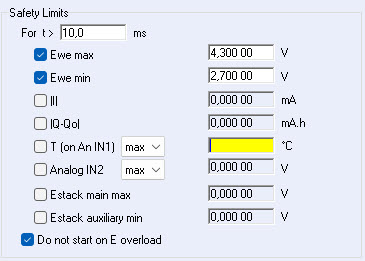
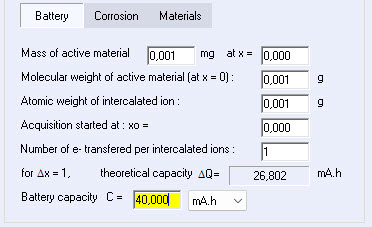
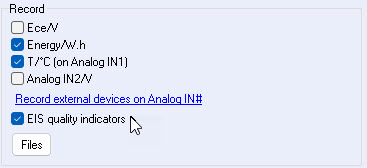
Figure 1: Safety limits (left), battery capacity (center), EIS quality indicators (right)
Unsure about cable length effects? BioLogic cell cables are custom-designed to minimize parasitic contributions (learn more here) and EC-Lab® post-processing compensation algorithm correct impedance measurements when using longer cables.
A practical guide to Dynamic EIS
The key to successful dynamic EIS measurements lies in a carefully designed experimental protocol that balances the need for comprehensive data with the practical constraints of real-world testing.
The following protocol illustrates how to capture impedance data throughout complete charge-discharge cycles. It can be adapted to specific cell parameters and research objectives. The underlying philosophy and measurement strategy are discussed below, however detailed sequences and values are intentionally not specified and left to the user.
Note: This example uses ModuloBat technique. Other techniques can be applied with the same underlying logic. In EC-Lab® software, you can save and reuse your own protocols with Custom Application feature.
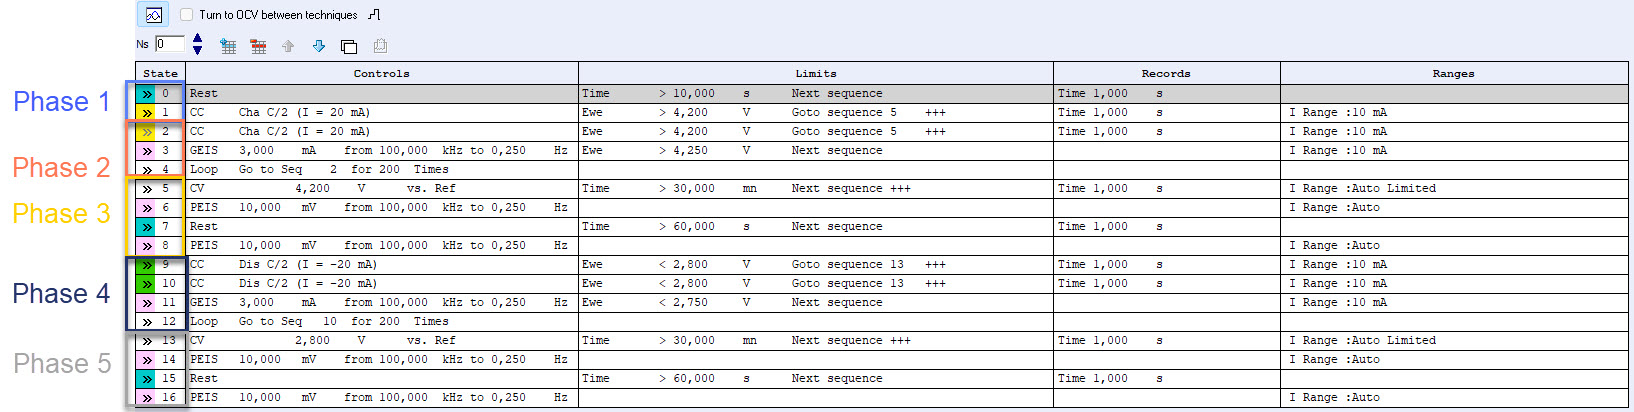
Figure 2: Protocol overview with Phase 1: Initial transient management, Phase 2: Charge with EIS loop, Phase 3: CV hold and post-charge EIS, Phase 4: Discharge with EIS loop, Phase 5: Post-discharge EIS and CV hold option
Phase 1: Initial transient management (Sequence 0-1)
Sequence 0 – Initial Rest: Begin with an initial rest period to enable the cell to reach thermal equilibrium and provides a reference point for subsequent measurements.
Sequence 1 – Initial current application: Apply constant current to begin charging the cell. As the cell starts to charge, it enters a transient state. This initial delay allows the cell to approach a more stable operating condition. Note: This sequence is NOT part of the main measurement loop – it serves only to stabilize the system before beginning measurements.
Phase 2: Charge with EIS loop (Sequence 2-4)
Sequence 2 – Charge current application: This is essentially a copy of sequence 1 but with a much shorter time limit. Since we’re now in a loop and the cell has already stabilized, we only need brief current pulses between EIS measurements.
Sequence 3 – Galvanostatic EIS (GEIS): Current amplitude should be optimized based on your specific cell chemistry and existing data. The goal is to find an amplitude that provides good signal-to-noise ratio without significantly perturbing the system. Note: The voltage limit during GEIS should be slightly higher than the target value to avoid the sequence terminating prematurely when the upper limit is reached and to allow the spectrum to reach completion (the AC amplitude applied over the DC current causes voltage excursions above and below the DC level).
Sequence 4 – Loop: Return to Sequence 2 to continue the measurement cycle.
Phase 3: CV hold and post-charge EIS (Sequence 5-8)
Sequence 5 – Constant Voltage Hold: After reaching the charge voltage cutoff, hold at constant voltage.
Sequence 6 – Potentiostatic EIS (PEIS) after CV: Perform EIS while holding at the final voltage. The cell is now in equilibrium at this voltage, providing a different perspective than the dynamic measurements.
Sequence 7 – Rest Period: Allow the cell to relax after the CV hold.
Sequence 8 – PEIS after relaxation: Perform another EIS measurement after the cell has relaxed. This provides insight into the cell’s open-circuit behavior following charge.
Protocol variation: It is possible to loop Sequences 5 and 6 to obtain multiple EIS spectra throughout the CV hold. This would require two CV sequences: one for initial stabilization and another for the repeated loop.
Phase 4: Discharge with EIS loop (Sequence 9-12)
These sequences mirror Sequences 1-4 but for discharge.
Sequence 9: Initial discharge current application.
Sequence 10: Brief discharge current.
Sequence 11: GEIS during discharge (with voltage limit slightly below the cutoff).
Sequence 12: Loop back to Sequence 10.
Phase 5: Post-discharge EIS with CV hold option (Sequence 13-16)
Whether to include CV hold sequence depends on your research goals. This example includes both approaches for completeness.
Sequence 13 – Discharge Voltage Hold (optional): This phase is less common. Holding the final discharge voltage brings the cell to equilibrium at a fully discharged state, which can be scientifically valuable.
Sequence 14 – PEIS after CV (optional): Perform EIS while holding at the final voltage.
Sequence 15 – Rest: Allow the cell to relax after the discharge (or CV hold, if Sequences 13 and 14 are performed).
Sequence 16 – PEIS after rest: Perform another EIS measurement after the cell has relaxed. This provides insight into the cell’s open-circuit behavior following discharge.
Dynamic EIS in action: real results
The following example illustrates the application of the dynamic EIS protocol described above. It was performed on a lithium-ion battery (LIR2032, 3.6 V nominal voltage, 40 mAh nominal capacity), using a VSP-300 (Premium Range potentiostat) and a CCH-1 coin-cell holder, with measurements conducted at a regulated temperature of 20°C.
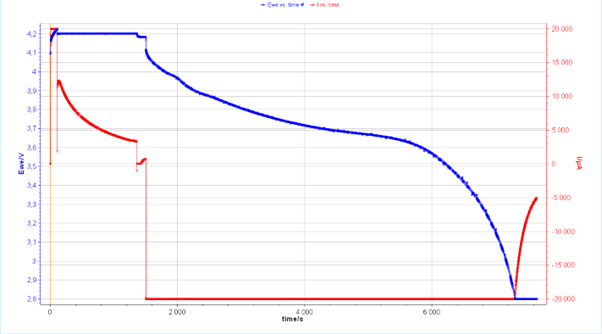
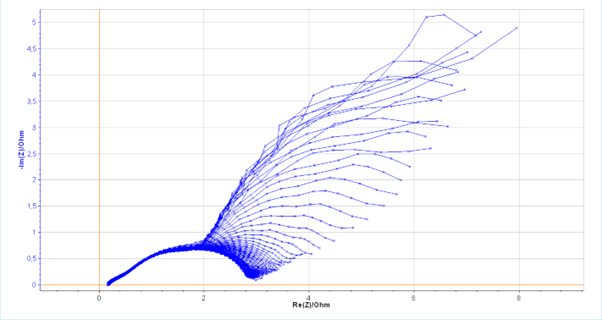
Figure 3: Nyquist impedance results (right) obtained while charging and discharging (left) for a lithium-ion battery (LIR2032, 3.6 V nominal voltage, 40 mAh nominal capacity)
In dynamic EIS, it is essential to verify the validity of the data. The EIS QITM can be checked: a THD and NSD below 5% generally indicates a linear and stationary system. In this experiment, the values show good quality data overall, except at low frequencies where the NSD increases. To ensure full rigor, the low-frequency data could be excluded from further analysis.
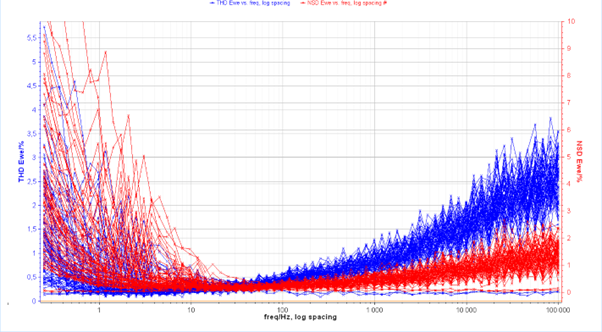
Figure 4: Checking the data validity with EIS QI™: THD and NSD quality indicators
Ready to try Dynamic EIS?
Dynamic EIS represents a significant advancement in battery characterization. While the technique requires careful protocol design and attention to measurement parameters, the resulting data provides insights that simply cannot be obtained through traditional steady-state measurements.
As the battery industry continues to push toward faster charging, longer lifetimes, and improved safety, dynamic EIS will become an increasingly essential tool for characterizing electrochemical processes, degradation mechanisms, and diffusion phenomena in the researcher’s arsenal. By implementing the protocol outlined here and carefully optimizing the adjustable parameters for your specific application, you can capture the full picture of your battery’s electrochemical behavior throughout its operating cycle.
The future of battery testing is dynamic—and with proper implementation, your research can stay ahead of the curve.
References
[1] ZHANG, Xinyi, LU, Yunpei, SHI, Jingfu, et al. Dynamic Electrochemical Impedance Spectroscopy: A Forward Application Approach for Lithium‐Ion Battery Status Assessment. EcoMat, 2025, vol. 7, no 7, p. e70018. https://doi.org/10.1002/eom2.70018


