

How to measure the ohmic resistance of a battery using EIS (EIS-high-frequency-internal-resistance) Battery – Application Note 62
Latest updated: April 29, 2025Abstract
The internal resistance of a battery can be used as a characteristic to estimate its State of Charge (SoC) or State of Health (SoH). In this note, we explain why the best way to measure this resistance is to perform an impedance measurement at several frequencies and use a tool such as Z Fit to fit the data.
Introduction
A battery is the association of a series of components including a positive electrode, a separator (used here as a generic term, which includes the electrolyte) and a negative electrode. The impedance of a battery can be stated as follows:
$$Z=Z_+ + Z_- + R_\Omega\tag{1}$$
where Z+ and Z–, are the impedance of the positive electrode and the negative electrode, respectively, and RΩ is the sum of the resistance of the separator, the current collectors and the connections. RΩ depends on the ionic conductivity of the electrolyte contained in the separator and on the electronic conductivity of the current collectors.
During discharge, the positive electrode works as a cathode and the negative electrode as an anode. During the charge, the positive electrode works as an anode and the negative electrode as a cathode.
During battery discharge, charge and ageing, the composition of the electrodes and the electrolyte can change and lead to a change of RΩ. The formation or dissolution of resistive layers, parasitic reactions or the degradation of the various battery elements can also lead to a change of RΩ, which we will refer to as the internal resistance of the battery.
The aim of this note is to present different methods to measure the internal resistance using impedance measurements. We will also explain that performing impedance measurements at several frequencies and fitting the impedance graph will reduce the uncertainty of carrying out internal resistance measurement.
Many Ways to Measure RΩ
Several methods have been proposed in the literature to measure the internal resistance. A dozen methods are described in [1]. Temporal and frequential methods have been compared in EC-Lab® application notes 27, 28 and 38 [2, 3, 4]. The two most common methods are presented below.
Current Interrupt
The principle of the current interrupt method, or potential-decay method, is that an ohmic contribution appears when an electrical contact is established and a non-zero current is flowing. The reverse phenomenon happens when the electrical contact is switched off: the ohmic contribution disappears almost instantaneously. In EC-Lab® the sampling rate is 200 µs, which limits temporal methods. This limitation does not apply in EIS because under-sampling is used to measure frequencies that are over the sampling rate allowed by the instrument.
EIS
Measuring the internal resistance by EIS is quite an old method. We can for example mention the measurement of the separator resistance of a battery [5] or the internal resistance of lead-acid batteries [6] or NiCd batteries [7] (Fig. 1). The measurement details are not always given. Some patents describe batteries with a very small internal resistance or show a charge-discharge control device using the rate of change of internal resistance as an indicator [8, 9].
![Top: Change in internal resistance of a 6 V, 2.6 Ah lead-acid battery with SoC. Impedance measured at OCV. Figures taken from [6]. Bottom: internal resistance change vs. State of Charge (SoC) for a Mazda Ni-Cd type NCR6, 0.65 Ah battery through a 30 Ω constant load. Figure taken from [7].](data:image/svg+xml;base64,PHN2ZyB4bWxucz0iaHR0cDovL3d3dy53My5vcmcvMjAwMC9zdmciIHdpZHRoPSI0MTMiIGhlaWdodD0iNTI4IiB2aWV3Qm94PSIwIDAgNDEzIDUyOCI+PHJlY3Qgd2lkdGg9IjEwMCUiIGhlaWdodD0iMTAwJSIgc3R5bGU9ImZpbGw6I2NmZDRkYjtmaWxsLW9wYWNpdHk6IDAuMTsiLz48L3N2Zz4=)
Figure 1: Top: Change in internal resistance of a 6 V, 2.6 Ah lead-acid battery with SoC. Impedance measured at OCV. Figures taken from [6]. Bottom: internal resistance change vs. State of Charge (SoC) for a Mazda Ni-Cd type NCR6, 0.65 Ah battery through a 30 Ω constant load. Figure taken from [7].
![Top: Change in internal resistance of a 6 V, 2.6 Ah lead-acid battery with SoC. Impedance measured at OCV. Figures taken from [6]. Bottom: internal resistance change vs. State of Charge (SoC) for a Mazda Ni-Cd type NCR6, 0.65 Ah battery through a 30 Ω constant load. Figure taken from [7].](https://biologic.net/wp-content/uploads/2019/08/an62f1.png)
High Frequencies (HF) Behaviour of The Impedance of a Battery
The principles of impedance measurements for batteries and their analysis are presented in the White Paper named “Studying batteries with Electrochemical Impedance Spectroscopy (EIS)”. Low frequency data interpretation is given in the application note “How to interpret lower frequencies impedance in batteries” [10].
The behavior of a battery separator or an electrolyte is, a priori, only resistive. It is only at very high frequencies that the dielectric behavior of ionic conductors is visible [11].
An example of an impedance graph of a Li-ion battery is shown in Fig. 2. The HF limit is not resistive but is characteristic of an inductive behavior related to the battery size, the battery connectors and the power leads. In this case, how can we measure the internal resistance? One obvious method is to choose a particular data point.

Figure 2: Example of an impedance diagram of Li-ion battery. HF High Frequencies, MF Medium Frequencies, LF Low Frequencies.

Single Point Determination
Several methods with one impedance measurement point are used to approximate the measurement of RΩ (Fig. 3).

Figure 3: Inset of the HF part of the impedance graph shown in Fig. 2. Comparison of the internal resistance measurement obtained using the impedance real part at minimal phase absolute value or zero phase (red dot), the minimal impedance module (black dot) or the minimal impedance real part (green dot).

a. Impedance real part at minimal phase absolute value RΩ, Φ=0
The high-frequency resistance at which the impedance diagram in the Nyquist plot intercepts the real axis (noted RHF) was used to approximate the internal resistance of a lead-acid battery [12] and, more recently, of a Li-ion battery [13].
The electrochemical impedance of the system must be previously measured before performing the measurements of RHF. There is no reason why for any graph there is a point at zero phase, in which case the chosen value will be the impedance real part at minimal phase absolute value (Fig. 3, red dot).
b. Minimal impedance real part RΩ, min
The minimal value of the impedance real part was used to approximate the internal resistance of a Li-ion battery [14]. The value corresponds to the impedance value at approximately 1 kHz and justifies the application of 1 kHz impedance measurement for characterization of aging effects.
This result is only coincidental as can be shown by the example in Fig. 2 where the 1 kHz frequency is close to the frequency of the zero-phase impedance.
Determination by Fitting an Impedance Graph Obtained at Several Frequencies
In this part of the application note, we will present the limitations of the single point measurement, why it cannot lead to an accurate determination of internal resistance and why the only way to get an accurate value of internal resistance is to perform an impedance measurement at various frequencies and perform fitting of all or part of the data. This can be performed using EC-Lab® fitting tool ZFit.
An important step in the fitting process is the choice of the equivalent circuit. It can be useful to simulate impedance graphs to qualitatively validate the possible shapes of the impedance graphs of equivalent circuits (Fig. 4). Such a simulation can be performed using ZSim available in EC-Lab®.
a. Accounting for battery changes
For single point measurements, the choice of the frequency is crucial. It is never certain that a correct frequency, at a given state of charge or state of health, will still be correct during battery operation and/or ageing.
This is the major problem when choosing a single frequency point or a single value to determine the internal resistance.
b. Accounting for the HF inductive behavior
The influence of an inductance in series on the impedance graphs of batteries has been studied since at least 1987 [16] (Fig. 4(1)), but the HF behavior of batteries does not always correspond to that of an inductor as is shown by the impedance graph in Fig. 2. The impedance element:
$$Z_{La}=La(i\omega)^{\alpha}\tag{2}$$
is available in ZFit [17]. Its impedance graph is a half-line making an απ/2 angle with the real axis as recalled in Fig. 4(2).
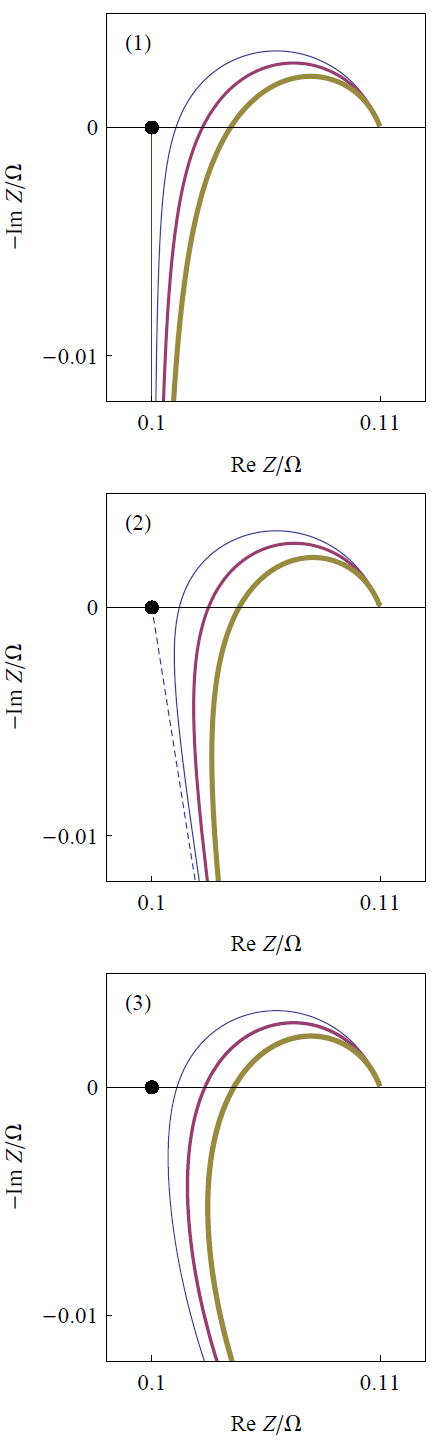
The first two cases in 4 lead to an impedance graph, whose HF limit asymptotically tends to a half-line. The HF graph is not a line anymore in the case (3) of Fig. 4, which is closer to the behaviour shown in Fig. 2. Using ZFit [18] allows the user to simulate curves shown in Fig. 4.
The visual comparison of impedance graphs shown in Fig. 4 and in Fig. 2 lead to the choice of circuits R1+L2/R2 and R1+L2/R2+Q3/R3+Q4/R4-+Q5 to account for the HF part of the diagram and the entire graph, respectively. Fitting results are shown. in Fig. 5.

Figure 4: Change of impedance graphs of circuits R1+L2+R3/Q3 (1), R1+La1+Q3/R3 (2) et R1+L2/R2+Q3/R3 (3) for various L1 values. The thickness of the lines increases with L1 and La1 values. The black dot corresponds to R1.
The value of R1 obtained by fitting is shown in Fig. 5. Its value is lower than the values determined using a single point measurement or a single point on the impedance graph (Tab. I). For this system, the maximum difference can reach 4.26%. It could be much larger for other systems.

Figure 5: HF inset of the impedance graph of Fig. 2. Line: fitting result. Comparison of the various internal resistances obtained by single point measurement methods and by fit.
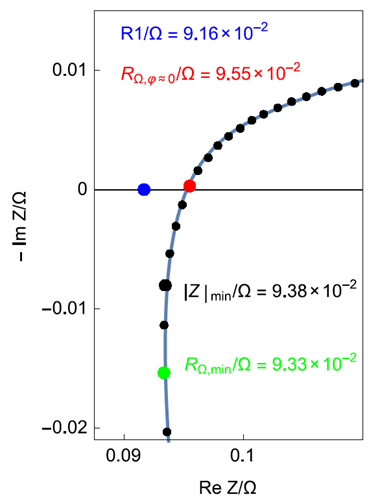
Table I: Internal resistance value depending on the measurement method. R 1 fit = 0.0916 Ω.
| R | Rmes/Ω | /% |
|---|---|---|
| RΩ,φ=0 | 0.0955 | 4.26 |
| |Z|min | 0.0938 | 2.40 |
| RΩ,min | 0.0933 | 1.86 |
Conclusion
Several methods can be used to measure the internal resistance of a battery using its impedance graph. It can be chosen to perform a single frequency point measurement and use the value of the real part of the impedance.
It can be chosen to perform impedance at several frequencies and to graphically choose a point on the graph, for example the minimal impedance modulus or the real part of the impedance at a zero phase. This can be erroneous for two reasons:
- as the battery changes the correct frequency at a given battery state can be erroneous at a different state
- choosing a point on the impedance graph neglects the presence of an inductive behavior.
Only impedance graphs made at different frequencies and subsequent fitting can prevent the user from favoring a particular point on the graph, allowing the user to account for the change of the battery during operation or ageing, and finally remove the effect of the inductance, which can dramatically affect the resistive HF behavior of a battery.
Data files can be found in :
C:\Users\xxx\Documents\EC-Lab\Data\Samples\Battery\ AN62_EIS_Fig_2
References
1) H.-G. Shweiger, O. Obeidi, O. Komesker, A. Raschke, M. Schiemann, C. Zehner, M. Gehnen, M. Keller, P. Birke, Sensors 10 (2010) 5605.
2) Application note #27 “Ohmic drop. I-Effect on measurements.”
3) Application note #28 “Ohmic drop. II-Introduction to Ohmic Drop measurement techniques.”
4) Application note #38. Dynamic resistance de-termination. A relation between AC and DC measurements?
5) W. P. Kilroy, C. T. Moynihan, J. Electrochem. Soc. 125 (4) (1978) 520 – 522.
6) R. Barton, P. Mitchell, J. Power Sources 27, 4 (1989) 287.
7) J.-P. Diard, B. Le Gorrec, C. Montella, J. Power Sources 70 (1998) 78.
8) K. Kitoh, US Patent 6,858,348 (Feb. 22 2005).
9) T. Sakakibara, S. Sakai, Y. Nakayama, US Patent 6, 987, 377 (Jan. 17 2006).
10) Application note #61 “How to interpret lower frequencies impedance in batteries ?”
11) G. Barral, J.-P. Diard, B. LeGorrec, Lu Dac Tri , C. Montella, J. Appl. Electrochem. 15, 6 (1985) 913.
12) F. Huet, R. P. Nogueira, L. Torcheux, P. Lailler, J. Power Sources 113 (2003) 414.
13) I. Jimenez Gordon, S. Géniès, G. Si Larbi, A. Boulineau, L. Daniel, M. Alias, J. Power Sources 307, (2016) 788.
14) U. Tröltzsch, O. Kanoun, H.-R. Trankler, Electrochim. Acta 51, (2006) 1664.
15) PNGV Battery Test Manual, U.S. Department of Energy, Piscataway, USA, 2001, (last accessed in April 29, 2025).
16) B. Savova-Stoynov, Z. B. Stoynov, J. Appl. Electrochem. 17, (1987) 1150.
17) Application note #42 “ZFit : The modified in-ductance element La.”
18) EC-Lab® Software download
Revised in 08/2019


